——————————
| Delaware | 68-0370244 |
| (State or other jurisdiction of incorporation or organization) | (I.R.S. Employer Identification No.) |
| 2201 South McDowell Boulevard Petaluma, California (Address of principal executive offices) |
94954 (Zip Code) |
Indicate by check mark whether the registrant (1) has filed all reports required to be filed by Section 13 or 15(d) of the Securities Exchange Act of 1934 during the preceding 12 months (or for such shorter period that the Registrant was required to file reports) and (2) has been subject to such filing requirements for the past 90 days. Yes [X] No [ ]
Indicate by check mark if disclosure of delinquent filers pursuant to Item 405 of Regulation S-K is not contained herein, and will not be contained, to the best of registrant’s knowledge, in definitive proxy or information statements incorporated by reference in Part III of this Form 10-K or any amendment to this Form 10-K. [ ]
Indicate by check mark if the registrant is an accelerated filer (as defined in Exchange Act Rule 12b-2) Yes [ ] No [X]
The aggregate market value of the voting and non-voting common equity held by non-affiliates of the registrant, based on the closing sale price of the common stock on September 30, 2004 as reported on the Nasdaq Smallcap Market, was $59,593,820. As of June 24, 2005, 52,924,144 shares of the registrant’s common stock were outstanding.
See Explanatory Notes
We are filing this amended Annual Report on Form 10-K/A (the “Amendment”) to amend our Annual Report on Form 10-K for the fiscal year ended March 31, 2005, as filed with the Securities and Exchange Commission on June 29, 2005 (the “10-K”). The principal purpose of the Amendment is to include in Part III the information that was to be incorporated by reference to the Proxy Statement for our 2005 Annual Meeting of Stockholders and to correct typographical errors in the additional paid-in capital numbers in the Consolidated Balance Sheet and the Consolidated Statements of Stockholders’ Equity for fiscal year ended 2004.
| PART I | Page | |
| Item 1. | Business | 3 |
| Item 2. | Properties | 10 |
| Item 3. | Legal Proceedings | 10 |
| Item 4. | Submission of Matters to a Vote of Security Holders | 10 |
| PART II | ||
| Item 5. | Market for Registrant's Common Equity, Related Stockholder Matters and Issue Purchases of Equity Securities | 11 |
| Item 6. | Selected Financial Data | 12 |
| Item 7. | Management's Discussion and Analysis of Financial Condition and Results of Operations | 13 |
| Item 7A. | Quantitative and Qualitative Disclosure about Market Risks | 26 |
| Item 8. | Financial Statements and Supplementary Data | 27 |
| Item 9. | Changes in and Disagreements with Accountants on Accounting and Financial Disclosure | 52 |
| Item 9A. | Controls and Procedures | 52 |
| PART III | ||
| Item 10. | Directors and Executive Officers of the Registrant | 53 |
| Item 11. | Executive Compensation | 55 |
| Item 12. | Security Ownership of Certain Beneficial Owners and Management | 61 |
| Item 13. | Certain Relationships and Related Transactions | 64 |
| Item 14. | Principal Accountant Fees and Services | 64 |
| PART IV | ||
| Item 15. | Exhibits, Financial Statement Schedules | 66 |
| Signatures | 70 |
Information contained or incorporated by reference herein contains forward-looking statements. These forward-looking statements are based on current expectations and beliefs and involve numerous risks and uncertainties that could cause actual results to differ materially from expectations. These forward-looking statements should not be relied upon as predictions of future events as we cannot assure you that the events or circumstances reflected in these statements will be achieved or will occur. You can identify forward-looking statements by the use of forward-looking terminology such as “may,” “will,” “expect,” “anticipate,” “estimate” or “continue” or the negative thereof or other variations thereon or comparable terminology or which constitute projected financial information. For a discussion of the factors that could cause actual results to differ materially from the forward-looking statements, see the “Financial Condition” and “Risk Factors” sections set forth in “Management’s Discussion and Analysis of Financial Condition and Results of Operations” beginning on page 13 below and such other risks and uncertainties as set forth below in this report or detailed in our other Securities and Exchange Commission reports and filings. We assume no obligation to update forward-looking statements.
All dollar amounts are in thousands unless specified otherwise.
Tegal Corporation, a Delaware corporation (“Tegal” or the “Company”), designs, manufactures, markets and services plasma etch and deposition systems that enable the production of integrated circuits (“ICs”), memory and related microelectronics devices used in personal computers, wireless voice and data telecommunications, contact-less transaction devices, radio frequency identification devices (“RFIDs”), smart cards, data storage and micro-level actuators. Etching and deposition constitute two of the principal IC and related device production process steps and each must be performed numerous times in the production of such devices.
We were formed in December 1989 to acquire the operations of the former Tegal Corporation, a division of Motorola, Inc. (“Motorola”). Our predecessor company was founded in 1972 and acquired by Motorola in 1978. We completed our initial public offering in October 1995.
On August 30, 2002, we acquired all of the outstanding common stock of Sputtered Films, Incorporated (“SFI”), a privately held California corporation. SFI is a leader in the design, manufacture and service of high performance physical vapor deposition sputtering systems for the semiconductor and semiconductor packaging industry. SFI was founded in 1967 with the development of its core technology, the S-Gun.
On November 11, 2003, we acquired substantially all of the assets and certain liabilities of Simplus Systems Corporation, (“Simplus”), a development stage company. Simplus had developed a deposition cluster tool and certain patented processes for barrier, copper seed and high-K dielectric applications. Simplus had coined the term “nano-layer deposition” or “NLD” to describe its unique approach to molecular organic chemical vapor deposition (“MOCVD”). We are continuing to develop these NLD processes and related tools, and are in the process of marketing them to a limited number of key customers and joint development partners.
On May 28, 2004, we purchased substantially all of the assets and assumed certain liabilities of First Derivative Systems, Inc. (“FDSI”). FDSI, a privately held development stage company, was founded in 1999 as a spin-off of SFI. FDSI had developed a high-throughput, low cost-of-ownership physical vapor deposition (“PVD”) system with highly differentiated technology for leading edge memory and logic device production on 200 and 300 millimeter wafers.
Over the past twenty years, the semiconductor industry has experienced significant growth. This growth has resulted from the increasing demand for ICs from traditional IC markets, such as personal computers, telecommunications, consumer electronics, automotive electronics and office equipment, as well as developing markets, such as wireless communications, multimedia and portable and network computing. As a result of this increased demand, semiconductor device manufacturers have periodically expended significant amounts of capital to build new semiconductor fabrication facilities (“fabs”) and to expand existing fabs. More recently, growth has slowed, and there are signs that the industry is beginning to mature. While unit demand for semiconductor devices continue to rise, the average selling prices of chips continue to decline. There is growing pressure on semiconductor device manufacturers to reduce manufacturing costs while increasing the value of their products. The semiconductor industry has also been historically cyclical, with periods of rapid expansion followed by periods of over-capacity.
Growth in the semiconductor industry has been driven, in large part, by advances in semiconductor performance at a decreasing cost per function. Advanced semiconductor processing technologies increasingly allow semiconductor manufacturers to produce ICs with smaller features, thereby increasing processing speed and expanding device functionality and memory capacity. As ICs have become more complex, however, both the number and price of state of the art process tools required to manufacture ICs have increased significantly. As a result, the cost of semiconductor manufacturing equipment has become an increasingly large part of the total cost of producing advanced ICs.
To create an IC, semiconductor wafers are subjected to a large number of complex process steps. The three primary steps in manufacturing ICs are (1) deposition, in which a layer of insulating or conducting material is deposited on the wafer surface, (2) photolithography, in which the circuit pattern is projected onto a light sensitive material (the photoresist), and (3) etch, in which the unmasked parts of the deposited material on the wafer are selectively removed to form the IC circuit pattern.
Each step of the manufacturing process for ICs requires specialized manufacturing equipment. Today, plasma-based systems are used for the great majority of both deposition and etching processes. During physical vapor deposition (also known as “PVD”), the semiconductor wafer is exposed to a plasma environment that forms continuous thin films of electrically insulating or electrically conductive layers on the semiconductor wafer. During a plasma etch process (also known as “dry etch”), a semiconductor wafer is exposed to a plasma composed of a reactive gas, such as chlorine, which etches away selected portions of the layer underlying the patterned photoresist layer.
Our business objective is to utilize the unique technologies that we have developed internally or acquired externally in order to increase our market share in process equipment for both semiconductor manufacturing and nanotechnology device fabrication. The following are key elements of our strategy:
Maintain our Technology Leadership Position in New Materials Etch – We have become a leading provider of etch process solutions for a set of new materials central to the production of an array of advanced semiconductor and nanotechnology devices in emerging markets. Incorporation of these new materials is essential to achieving the higher device densities, lower power consumption and novel functions exhibited by the newest generation of cell phones, computer memories, fiber optic switches and remote sensors. Currently, we are the leading supplier of etch solutions to makers of advanced “non-volatile” ferro-electric (“FeRAM”), magnetic (“MRAM”) devices, and virtually all other types of non-volatile memories. FeRAM is just now entering commercial production with chips for the newest generation of cell phones, PDA’s, smart cards and RFIDs, used for applications such as railway passes and ink jet cartridge tracking. Our new materials expertise also includes the etching of so-called “compound-semi” materials, such as GaAs, GaN and InP, widely used in telecom device production. In addition, we are known for our capability to etch certain noble metals, such as gold and platinum, as well as certain proprietary compound metals. This capability is increasingly important in advanced memory development and in the production of Micro-Electrical Mechanical Systems (“MEMS”), a type of commercially produced nanotechnology device, especially useful to the automotive industry.
Strengthen our Position in Deposition Process Equipment for Advanced Packaging Applications — Since 2002, we have completed two acquisitions of deposition products incorporating the same unique “sputter-up” technology. This technology is directed principally at so-called “back-end” semiconductor manufacturing processes, including backside metallization and underbump metal processes, for both 200mm and 300mm wafer sizes. These processes are important to advanced, wafer-level packaging schemes, which are increasingly being used for high-pin-count logic and memory devices.
Introduce a New Product into Established Equipment Market — The continued development of our recently acquired nano-layer deposition technology represents our belief that we have a compelling solution to a critical process need in present-day and future semiconductor device fabrication. The market for depositing films via conventional chemical vapor deposition (“CVD”) process equipment represents approximately $3.8 billion annually in equipment sales (VLSI, 2004). As device geometries continue to shrink, conventional CVD process equipment is increasingly incapable of depositing thin conformal films in high-aspect ratio trenches and vias. Atomic Level Deposition (“ALD”) is one technology for satisfying this deposition requirement. However, ALD has several shortcomings, including low throughput and limitations on film type and quality, which we believe our NLD technology overcomes.
Maintain our Service Leadership Position — Tegal has been consistently recognized by our customers for providing a high level of customer support, a fact that has been noted by our top rankings for several consecutive years in the annual survey conducted by VLSI Research, Inc. We expect to maintain and build on this reputation as we seek new customers in both emerging and established markets.
Tegal’s historical strength has been in plasma etch technologies. We currently offer products that address widely divergent needs of semiconductor and nanotechnology device manufacturers.
As ICs become increasingly complex, certain etch steps required to manufacture a state of the art IC demand leading edge etch technology, where the ability to perform the etch is more important than the cost of the tool. In other applications, low cost-of-ownership and high performance in routine process steps are essential.
Today, the semiconductor industry is faced with the need to develop and adopt an unprecedented number of new materials as conventional films are running out of the physical properties needed to support continuing shrinks in die size and to provide improved performance. Certain of these new materials present unique etch production problems. For example, the use of certain films, such as platinum, iridium and Lead Zirconium Titanate (“PZT”), currently being used in the development of non-volatile FeRAM devices, is presenting new challenges to semiconductor manufacturers. MRAM devices incorporate unique magnetic materials in the device structures, as do certain proposed resistive random access memory “RRAM” devices. While these new films contribute to improved device performance and reduced die size, their unique properties make them particularly difficult to etch and, therefore, require more advanced etch process technologies.
6500 Series Etch Products
We offer several models of our 6500 series etch products configured to address film types and applications desired by our customers. We introduced the 6500 series tool in 1994 and since that time have extended the product line to address new applications including:
• |
new-high K dielectrics and associated materials used in capacitors at sub-0.5 micron for FeRAMs, high-density DRAM and MRAM devices; |
• |
shallow trench isolation used to isolate transistors driven by increased packing densities used in memory devices employing design rules at or below 0.25 micron; |
• |
sub-0.5 micron multi-layer metal films composed of aluminum/copper/silicon/titanium alloys; |
• |
sub-0.5 micron polysilicon; |
• |
compound semiconductor III-V materials; and |
• |
leading edge thin film head materials. |
All 6500 Series Plasma Etch systems feature either Tegal’s patented dual-frequency HRe–™ CCP or Spectra™ ICP process module technology. The production tested cluster platform design incorporated on all 6500 systems accommodates either one or two etch process modules for processing of 100mm to 200mm wafers. Each module can be configured to run independent processes-optimizing flexibility, minimizing downtime and maximizing wafer throughput. The 6500 system comes standard with one vacuum cassette elevator for wafer input/output. Optionally, a second vacuum cassette elevator or patented Rinse-Strip-Rinse™ corrosion passivation station may be added within the standard frame. Each system incorporates full cluster tool technology with the latest innovations in contamination control and factory automation. Tegal’s 6500 Series systems have demonstrated their effectiveness in addressing the challenges of etching new materials in a production environment now and in the future.
900 Series Etch Products
We introduced our 900 series family of etch systems in 1984 as the advanced etch tool of that era. Over the years, we have enhanced the 900 series family as systems capable of performing certain routine etch steps required in the production of silicon-based IC devices and, more recently, as etch tools for advanced specialty devices such as gallium arsenide for high-speed telecommunications devices. In 1994, we introduced an eight-inch wafer capable 900 series system (capable of etching five-inch to eight-inch wafers). The 900 series etch systems are aimed at pad, zero layer, non-selective nitride, backside, planarization and small flat panel display applications, thin film etch applications used in the manufacture of read-write heads for the disk drive industry and gallium arsenide and other III-V materials used in high-speed digital wireless telecommunications applications.
The 900ACS™ was introduced in July 2000. This system has enhanced the functionality of the 900 series with added features such as user-friendly GUI (graphical user interface) touch screens, better process control and an improved transport system that increase efficiency, while preserving the durability for which the tool is known.
Certain deposition technologies or processes are better suited than others for depositing different types of materials (films). PVD is used for both metallic thin film deposition and, in reactive PVD processes, for dielectric thin film deposition. An important application for PVD is the deposition of thin films where residual film stress must be closely controlled in order to create specific desired electrical results, as in precision thin film resistor fabrication, or to avoid physically deforming the substrate, as in the fabrication of power MOS devices on ultra-thin silicon wafers. We believe that enabling tight control of stress and other process parameters, along with minimizing overall contamination levels during PVD thin film deposition processes, will be increasingly recognized by IC manufacturers as key features that differentiate PVD tool products and PVD tool makers. We also believe these capabilities will be important to device makers in the related industries of compound semiconductor device fabrication, LED fabrication, optical communication device manufacturing, in MEMS fabrication, and in the field of wafer-level packaging processes for microelectronic devices.
Both our 200mm and 300mm PVD technologies address the following applications:
• |
chip packaging technologies requiring stress control in multi-layer under bump metallization (UBM); |
• |
IC front side interconnect metallization; |
• |
Ohmic contact formation and metallization of thinned wafers for high power transistors; |
• |
deposition of thin film resistors with fine tuning of thermal capacitance of resistance (TCR); |
• |
barrier and seed layer deposition in deep vias; |
• |
encapsulating films for light emitting diodes (LED); |
• |
dielectric layers for sound acoustic wave (SAW) and film bulk acoustic resonators (FBARs); |
• |
dielectric layers for integrated gate bipolar transistors (IGBT); and |
• |
automobile electronics requiring high adhesion properties of the backside metal film stacks. |
Endeavor PVD™ Products
We offer several models of our Endeavor PVD products configured to address film types and applications desired by the customer. We introduced the Endeavor series tool in 1992 and since that time have expanded the product line to address new applications. The Endeavor PVD cluster tool features Tegal’s patented S-Gun™ magnetron sputtering source. The platform is designed to accept up to five process modules including a wide array of both dielectric and metal sputtering configurations in addition to plasma pre-clean modules. The transport system can accommodate 50mm to 200mm wafers, or 6” square reticles, in a unique “sputter-up” orientation that is extremely gentle and reliable. The unique handling system is especially advantageous for backside metallization on delicate ultra-thin silicon wafers, as it handles them without flipping or applying any mechanical pressure. Each system incorporates state-of-the-art cluster tool technology with the latest innovations in contamination control and factory automation.
OnCore™ PVD
We are currently developing the OnCore™ cluster tool for advanced 300mm PVD applications in wafer-level packaging and other back-end processes. The OnCore platform represents Tegal’s first product offering for 300mm semiconductor manufacturing. The OnCore PVD cluster tool is built on a mono-block vacuum chamber that allows up to 5 process modules, a pre-heat station, a cooling station, and two load locks, in a compact 2.5m x 2.5m footprint with significantly fewer vacuum seals than traditional cluster tool architecture. The result is a very cost-effective 300mm production platform both in terms of system price and cleanroom footprint. Process modules featured on the OnCore include Tegal’s newly patented Flat Magnetron and Hollow Cathode Array (HCA) source technologies.
Compact™ NLD
We are currently developing the Compact™ 360 NLD cluster tool as a new 200mm/300mm-capable bridge tool that will serve as the introductory platform for Tegal’s patented Nano-Layer Deposition process. NLD is a unique cyclic MOCVD process for highly conformal coatings that incorporates plasma film treatment with each deposition cycle. This offers the benefits of atomic layer deposition with the potential for a much higher deposition rate. NLD also offers the benefit of utilizing common MOCVD precursor materials that are readily available for a wide variety of metal, metal oxide and metal nitride films. The Tegal Compact platform can accommodate all wafer sizes from 100mm to 300mm in one, two or three process module configurations, with a wide variety of front-end loadlock options including FOUP and EFEM.
We sell our systems to semiconductor and related electronic device component manufacturers throughout the world. Major customers over the last three fiscal years have included the following:
| AMI AMS Fuji Film Fujitsu Hewlett Packard Intel International Rectifier Kodenshi |
Matsushita Motorola NEC Nortel Osram RF Micro Devices Ryosan Setech Inc |
Shanghai Belling Sony STMicroelectronics Toshiba United Microelectroics University Francois Rabelais Western Digital Winbond |
Of these 24 customers, six ordered one or more systems in fiscal 2005. The composition of our top five customers has changed from year to year, but net system sales to our top five customers in each of fiscal 2005, 2004, and 2003 accounted for 80.0%, 84.8% and 88.2%, respectively, of our total net system sales. Fujitsu, Western Digital, and RF Micro Devices accounted for 38.2%, 12.8% and 10.1% respectively, of our net system sales in 2005. Intel, Fuji Film, and Matsushita accounted for 31.4%, 22.9% and 12.6% respectively, of our net system sales in 2004. International Rectifier, University Francois, STMicroelectronics and OKI represented 32.2%, 22.7%, 12.5% and 12.0%, respectively, of our net system sales in 2003. Other than the above customers, no single customer represented more than 10% of our net system sales in fiscal 2005, 2004, and 2003. Although the composition of the group comprising our largest customers may vary from year to year, the loss of a significant customer or any reduction in orders by any significant customer, including reductions due to market, economic or competitive conditions in the semiconductor and related device manufacturing industry, may have a material adverse effect on us.
We schedule production of our systems based upon order backlog and customer commitments. We include in our backlog only orders for which written purchase orders have been accepted and shipment dates within the next 12 months have been assigned. As of May 31, 2005 and 2004, our order backlog was approximately $3,620 and $3,275, respectively. Booked system orders are subject to cancellation by the customer, but with substantial penalties except in the case of orders for evaluation systems or for systems that have not yet incurred production costs. Orders may be subject to rescheduling with limited or no penalty. Some orders are received for systems to be shipped in the same quarter as the order is received. As a result, our backlog at any particular date is not necessarily indicative of actual sales for any succeeding period.
We sell our systems worldwide through a network of eight direct sales personnel and eight independent sales representatives in sales offices located throughout the world. In the United States, we market our systems through direct sales personnel located in two regional sales offices and at our Petaluma, California headquarters. In addition, we provide field service and applications engineers through our regional locations and our Petaluma headquarters in order to ensure dedicated technical and field process support throughout the United States on short notice.
We maintain sales, service and process support capabilities in Japan, Taiwan, Germany, and Italy and service/support operations in Austria and China. In addition to our international direct sales and support organizations, we also market our systems through independent sales representatives in Israel, India, Turkey, China, South Korea and Singapore and selected markets in Japan.
International sales, which consist of export sales from the United States either directly to the end user or to one of our foreign subsidiaries, accounted for approximately 70%, 67% and 66% of total revenue for fiscal 2005, 2004, and 2003, respectively. Revenues by region for each of the last three fiscal years were as follows:
| Years Ended March 31, ————————————————— |
|||||||||||
|---|---|---|---|---|---|---|---|---|---|---|---|
| 2005 ———— |
2004 ———— |
2003 ———— | |||||||||
| United States | $ | 4,445 | $ | 5,538 | $ | 4,864 | |||||
| Asia, excluding Japan | 1,372 | 1,241 | 1,537 | ||||||||
| Japan | 6,312 | 6,485 | 2,934 | ||||||||
| Germany | 397 | 170 | 353 | ||||||||
| Italy | 498 | 1,480 | 1,851 | ||||||||
| Europe, excluding Germany and Italy | 1,864 | 1,614 | 2,561 | ||||||||
| Total sales | $ | 14,888 | $ | 16,528 | $ | 14,100 | |||||
We generally sell our systems on 30-to-60 day credit terms to our domestic and European customers. Customers in the Pacific Rim countries, other than Japan, are generally required to deliver a letter of credit payable in U.S. dollars upon system shipment. Sales to other international customers, including Japan, are billed either in local currency or U.S. dollars. We anticipate that international sales will continue to account for a significant portion of revenue in the foreseeable future.
We generally warrant our new systems for 12 months and our refurbished systems for six months from shipment. Our field engineers provide customers with call-out repair and maintenance services for a fee. Customers may also enter into repair and maintenance service contracts covering our systems. We train customer service engineers to perform routine service for a fee and provide telephone consultation services generally free of charge.
The sales cycles for our systems vary depending upon whether the system is an initial design-in, reorder or used equipment. Initial design-in sales cycles are typically 12 to 18 months, particularly for 6500 and Endeavor series systems. In contrast, reorder sales cycles are typically four to six months, and used system sales cycles are generally one to three months. The initial design-in sales cycle begins with the generation of a sales lead, which is followed by qualification of the lead, an analysis of the customer’s particular applications needs and problems, one or more presentations to the customer (frequently including extensive participation by our senior management), two to three wafer sample demonstrations, followed by customer testing of the results and extensive negotiations regarding the equipment’s process and reliability specifications. Initial design-in sales cycles are monitored by senior management for correct strategic approach and resource prioritization. We may, in some rare instances, need to provide the customer with an evaluation system for three to six months prior to the receipt of a firm purchase order.
The market for semiconductor capital equipment is characterized by rapid technological change. We believe that continued and timely development of new systems and enhancements to existing systems is necessary for us to maintain our competitive position. Accordingly, we devote a significant portion of our personnel and financial resources to research and development programs and seek to maintain close relationships with our customers in order to be responsive to their system needs.
Our research and development encompasses the following areas: plasma etch, physical vapor deposition and chemical vapor deposition (especially NLD) technologies, process characterization and development, material sciences applicable to etch and deposition environments, systems design and architecture, electro-mechanical design and software engineering. Management emphasizes advanced plasma and reactor chamber modeling capabilities in order to accelerate bringing advanced chamber designs to market. We employ multi-discipline teams to facilitate short engineering cycle times and rapid product development.
As of March 31, 2005, we had 24 full-time employees dedicated to equipment design engineering, process support and research and development. Research and development expenses for fiscal 2005, 2004, and 2003 were $5,772, $3,305 and $4,815, respectively, and represented 39.0%, 20.0% and 34.2% of total revenue, respectively. Such expenditures were primarily used for the development of new processes, continued enhancement and customization of existing systems, processing customer samples in our demonstration labs and providing process engineering support at customer sites. Additionally, we had in-process research and development expense of $1,653 which represented 11.0% of revenue for fiscal 2005 that was related to the acquisition of FDSI, and $2,202 which represented 13.3% of revenue for fiscal 2004 that was related to the acquisition of Simplus.
Our etch systems are produced at our headquarters in Petaluma, California. Deposition systems are currently produced at our facility in Santa Barbara, California. Our manufacturing activities consist of assembling and testing components and sub-assemblies, which are then integrated into finished systems. We have structured our production facilities to be driven either by orders or by forecasts and have adopted a modular system architecture to increase assembly efficiency and design flexibility. We have also implemented “just-in-time” manufacturing techniques in our assembly processes. Through the use of such techniques, 900 series system manufacturing cycle times take approximately 14 days and cycle times for our Endeavor systems and our 6500 series products take two to three months.
The semiconductor capital equipment industry is highly competitive. We believe that the principal competitive factor in the critical segments of the equipment industry is technical performance of the system, followed closely by the existence of customer relationships, the system price, the ability to provide service and technical support on a global basis and other related cost factors. We believe that the principal competitive factor in the non-critical segments of the equipment industry is system price, followed closely by the technical performance of the system, the existence of established customer relationships, the ability to provide service and technical support on a global basis and other related cost factors.
We hold an exclusive license or ownership of 82 U.S. patents, including both deposition and etch products, and 32 corresponding foreign patents covering various aspects of our systems. We have also applied for 43 additional U.S. patents and 73 additional foreign patents. Of these patents, a few expire as early as 2006, others expire as late as 2022 with the average expiration occurring in approximately 2015. We believe that the duration of such patents generally exceeds the life cycles of the technologies disclosed and claimed therein. We believe that although the patents we have exclusively licensed or hold directly will be of value, they will not determine our success, which depends principally upon our engineering, marketing, service and manufacturing skills. However, in the absence of patent protection, we may be vulnerable to competitors who attempt to imitate our systems, processes and manufacturing techniques. We have signed a non-exclusive field of use license to two of our patents, relating to our strategic application sets. In addition, other companies and inventors may receive patents that contain claims applicable to our systems and processes. The sale of our systems covered by such patents could require licenses that may not be available on acceptable terms, if at all. We also rely on trade secrets and other proprietary technology that we seek to protect, in part, through confidentiality agreements with employees, vendors, consultants and other parties. There can be no assurance that these agreements will not be breached, that we will have adequate remedies for any breach or that our trade secrets will not otherwise become known to or independently developed by others.
The original version of the system software for our 6500 series systems was jointly developed by us and Realtime Performance, Inc., a third-party software vendor. We hold a perpetual, non-exclusive, non-royalty-bearing license to use and enhance this software. The enhanced version of the software currently used on our 6500 series systems has undergone multiple releases of the original software, and such enhancements were developed exclusively by us. Neither the software vendor nor any other party has any right to use our current release of the system software. However, we cannot make any assurances that this software will not be illegally copied or reverse-engineered by either customers or third parties.
As of March 31, 2005, we had a total of 86 regular employees, one part-time contract personnel and two full-time contract personnel. Of our regular employees, six are in engineering, 18 are in research and development, 16 are in manufacturing and operations, 27 are in marketing, sales and customer service and support and 19 are in executive and administrative positions. Many of our employees are highly skilled, and our success will depend in part upon our ability to attract, retain and develop such employees. Skilled employees, especially employees with extensive technological backgrounds, remain in demand. There can be no assurance we will be able to attract or retain the skilled employees that may be necessary to continue our research and development, manufacturing or marketing programs. The loss of any such persons, as well as the failure to recruit additional key personnel in a timely manner, could have a material adverse effect on us.
None of our employees is represented by a labor union or covered by a collective bargaining agreement. We consider our employee relations to be good.
We maintain our headquarters, encompassing our executive office, manufacturing, engineering and research and development operations, in one leased 57,418 square foot facility in Petaluma, California. The lease, which was signed on April 30, 2004, expires on December 31, 2009. Other than certain large pieces of capital equipment leased by us, we own substantially all of the machinery and equipment used in our facilities. We believe that our existing facilities are adequate to meet our requirements for several years.
We lease an 18,000 square foot facility in Santa Barbara, California for manufacturing and support of Sputtered Films tools. We currently occupy about 10,700 square feet, and sublet the remaining portion for part of the year. The lease expires in September 2005 with an option to extend for three additional years.
We lease sales, service and process support space in Dresden, Germany, Munich, Germany, Kawasaki, Japan, Catania, Italy, Hsin Chu City, Taiwan and Shanghai, China.
Sputtered Films, Inc. v. Advanced Modular Sputtering, et al., filed in Santa Barbara County Superior Court.
On December 22, 2003, Sputtered Films, Inc. (“SFI”), a wholly owned subsidiary of the Company, filed an action against two former employees, Sergey Mishin and Rose Stuart-Curran, and a company they formed after leaving their employment with SFI named Advanced Modular Sputtering, Inc. (“AMS”). Sergey Mishin and Rose Stuart-Curran had each signed confidentiality and non-disclosure agreements regarding information obtained while employed by SFI. The action contains causes of action for specific performance, breach of contract, breach of the covenant of good faith and fair dealing, misappropriation of trade secrets, unfair competition, unfair business practices, interference with prospective economic advantage, conversion, unjust enrichment, and declaratory relief. These claims arise out of information SFI received evidencing that AMS possessed and used SFI’s confidential, proprietary and trade secret drawings, specifications and technology to manufacture the sputtering tool marketed by AMS.
The parties stipulated to a protective order in order to commence the discovery phase, and SFI has responded to the discovery propounded by AMS. To date, however, SFI has been prevented from commencing discovery against AMS or other third party witnesses (in particular, Agilent Technologies, Inc.) due to the trial court’s ruling that SFI has not yet described its trade secrets in sufficient detail pursuant to Code of Civil Procedure § 2019(d). In February 2005, the trial court ruled that SFI could proceed with discovery related to all causes of action, other than the trade secret cause of action. AMS petitioned the Court of Appeal for a writ reversing the trial court’s order, which petition was denied. On June 8, 2005, the Supreme Court granted review of AMS’s petition, and ordered the Court of Appeals to conduct the review. In light of the pending Court of Appeals review, the trial court vacated the previously set trial date and ordered a stay on all discovery by all parties.
No matter was submitted to a vote of security holders during the fourth quarter of fiscal year 2005.
Since May 6, 2003, our common stock has traded on the NASDAQ SmallCap Market under the symbol TGAL. Prior to this date, our common stock traded on the NASDAQ National Market since October 19, 1995. The following table sets forth the range of high and low sales prices for our common stock for each quarter during the prior two fiscal years.
| High | Low | |||||||
|---|---|---|---|---|---|---|---|---|
| FISCAL YEAR 2004 | ||||||||
| First Quarter | $ | 0 | .83 | $ | 0 | .300 | ||
| Second Quarter | 1 | .64 | 0 | .500 | ||||
| Third Quarter | 3 | .15 | 0 | .960 | ||||
| Fourth Quarter | 4 | .05 | 1 | .790 | ||||
| FISCAL YEAR 2005 | ||||||||
| First Quarter | $ | 2 | .73 | $ | 1 | .300 | ||
| Second Quarter | 1 | .91 | 0 | .900 | ||||
| Third Quarter | 1 | .83 | 1 | .080 | ||||
| Fourth Quarter | 1 | .59 | 0 | .900 | ||||
The approximate number holders of record of our common stock as of March 31, 2005 was 466. We have not paid any cash dividends since our inception and do not anticipate paying cash dividends in the foreseeable future.
| Plan Category | Number of securities to be issued upon exercise of outstanding options (a) |
Weighted-average exercise price of outstanding options (b) |
Number of securities remaining available for future issuance under equity compensation plans (excluding securities reflected in column (a)) (c) | ||||||||
|---|---|---|---|---|---|---|---|---|---|---|---|
| Equity compensation Plans approved by security holders | |||||||||||
| Equity Incentive Plan | 1,195,700 | $ | 4.41 | — | |||||||
| 1990 Stock Option Plan | 156,626 | 5.78 | — | ||||||||
| 1998 Equity Participation Plan | 5,658,919 | 1.38 | 3,666,096 | ||||||||
| Directors Stock Option Plan | 640,000 | 1.73 | 925,000 | ||||||||
| Total | 7,651,245 | $ | 1.97 | 4,591,096 | |||||||
| Year Ended March 31, ———————————————————— | |||||||||||
|---|---|---|---|---|---|---|---|---|---|---|---|
| 2005 ——————— |
2004 ——————— |
2003 ——————— | |||||||||
| Number of securities to be issued upon exercise of outstanding warrants | 4,312,960 | 5,006,551 | 1,693,552 | ||||||||
| Weighted-average exercise price of outstanding warrants | $ | 1.62 | $ | 1.39 | $ | 2.77 | |||||
Since April 1, 2004, we have issued and sold the following unregistered securities:
Common Stock
On February 11, 2004, we signed a $25 million equity facility with Kingsbridge Capital Limited (“Kingsbridge”). The arrangement allowed us to sell shares of our common stock to Kingsbridge at our sole discretion over a 24-month period on a “when and if needed” basis. Kingsbridge was required under the terms of the arrangement to purchase our stock following the effectiveness of a registration statement. The price of the common shares issued under the agreement was based on a discount to the volume-weighted average market price during a specified drawdown period. The number of shares issued to Kingsbridge under this agreement was 8,506,331. All of the shares were issued during fiscal year 2005.
| Year Ended March 31, —————————————————————— | |||||||||||||||||
|---|---|---|---|---|---|---|---|---|---|---|---|---|---|---|---|---|---|
| 2005 ———— |
2004 ———— |
2003 ———— |
2002 ———— |
2001 ———— | |||||||||||||
| (In thousands, except per share data) | |||||||||||||||||
| Consolidated Statements of Operations Data: | |||||||||||||||||
| Revenue | $ | 14,888 | $ | 16,528 | $ | 14,100 | $ | 21,606 | $ | 38,205 | |||||||
| Gross profit (loss) | 3,267 | 4,647 | (66 | ) | 6,676 | 13,915 | |||||||||||
| Operating loss | (13,522 | ) | (7,180 | ) | (12,617 | ) | (8,235 | ) | (7,226 | ) | |||||||
| Income (loss) before cumulative effect of change in | |||||||||||||||||
| accounting principle (2) | (15,363 | ) | (12,602 | ) | (12,625 | ) | (8,730 | ) | 1,096 | ||||||||
| Net income (loss) | (15,363 | ) | (12,602 | ) | (12,625 | ) | (8,730 | ) | 699 | ||||||||
| Net income (loss) per share: (1) | |||||||||||||||||
| Basic | (0.33 | ) | (0.56 | ) | (0.82 | ) | (0.67 | ) | 0.06 | ||||||||
| Diluted | (0.33 | ) | (0.56 | ) | (0.82 | ) | (0.67 | ) | 0.05 | ||||||||
| Shares used in per share computation: | |||||||||||||||||
| Basic | 46,879 | 22,442 | 15,311 | 13,030 | 12,499 | ||||||||||||
| Diluted | 46,879 | 22,442 | 15,311 | 13,030 | 12,838 | ||||||||||||
| March 31, ————————————————— | |||||||||||||||||
|---|---|---|---|---|---|---|---|---|---|---|---|---|---|---|---|---|---|
| 2005 ——— |
2004 ——— |
2003 ——— |
2002 ——— |
2001 ——— | |||||||||||||
| (In thousands, except per share data) | |||||||||||||||||
| Consolidated Balance Sheet Data: | |||||||||||||||||
| Cash and cash equivalents | $ | 7,093 | $ | 7,049 | $ | 912 | $ | 8,100 | $ | 12,649 | |||||||
| Working capital | 8,056 | 8,823 | 5,041 | 20,816 | 26,551 | ||||||||||||
| Total assets | 20,092 | 22,658 | 17,209 | 29,227 | 42,252 | ||||||||||||
| Debt obligations (excluding capital leases and 2% converti | |||||||||||||||||
| debentures) | 159 | 2,450 | 426 | 922 | 3,884 | ||||||||||||
| Stockholders' equity | 13,300 | 14,955 | 11,123 | 22,286 | 28,609 | ||||||||||||
| (1) | See Note 3 of our Consolidated Financial Statements for an explanation of the computation of earnings per share. |
| (2) | During the fourth quarter of fiscal 2001, we implemented SAB 101, retroactive to the beginning of the fiscal year. This was reported as a cumulative effect of a change in accounting principle as of April 1, 2000. The cumulative effect of the change in accounting principle on prior years resulted in a charge to income of $397 (net of income taxes of $25), which was included in income for the year ended March 31, 2001. For fiscal 2001, we recognized $478 in revenue that was included in the cumulative effect of the change in accounting principle. |
Tegal Corporation, a Delaware corporation (“Tegal”), designs, manufactures, markets and services plasma etch and deposition systems that enable the production of integrated circuits (“ICs”), memory and related microelectronics devices used in personal computers, wireless voice and data telecommunications, contact-less transaction devices, radio frequency identification devices (“RFIDs”), smart cards, data storage and micro-level actuators. Etching and deposition constitute two of the principal IC and related device production process steps and each must be performed numerous times in the production of such devices.
Our business objective is to utilize the unique technologies that we have developed internally or acquired externally in order to increase our market share in process equipment for both semiconductor manufacturing and nanotechnology device fabrication. In the recent past, we have attempted to “leap frog” more established competitors by being “designed-in” to the advanced device fabrication plans of our customers. We have done so primarily by engaging in R&D activities on behalf of our customers that our more established competitors were unwilling or unable to perform. Many of these advanced devices promise substantial returns as consumer demand for certain functions grows and new markets are created. However, the timing of the emergence of such demand, such as broadband wireless communications and RFID tags is highly uncertain. In addition, the successful integration by our customers of all of the various technical processes required to manufacture a device at an acceptable cost is also highly uncertain. As a result of our inability to accurately predict the timing of the emergence of these markets, our sales have declined over the past few years, while our costs for maintaining our R&D efforts, service and manufacturing infrastructure have remained constant or in some cases increased.
At the present time, we are transitioning the Company from a dependence on these highly unpredictable markets to more established equipment markets, where our success is dependent more on our ability to apply successfully our engineering capabilities to solving existing manufacturing problems. We are carefully managing this transition by limiting our R&D efforts to the most promising near-term sales opportunities, while at the same time redirecting all our available resources toward new products aimed at established equipment markets. Because of our relatively small size, our ability to meet the needs of individual customers is far more important to our success than either macro economic factors or industry-wide factors such as cyclicality, although both of these areas have some effect on our performance as well. As a result, our methods of evaluating our progress are highly customer focused.
With its current products, we believe that the Company has sufficient opportunities in both emerging and existing markets to allow it to resume a sales growth pattern in the coming year. Equally important is the reduction of operating costs. In the coming year, we expect to achieve savings in operating costs by focusing on the most promising opportunities while limiting our exposure to others, consolidating some of our operating facilities, outsourcing of non-critical activities, and reducing our utilization of outside consultants and advisors.
Our discussion and analysis of our financial condition and results of operations are based upon our consolidated financial statements, which have been prepared in accordance with accounting principles generally accepted in the United States of America. The preparation of these financial statements requires us to make estimates and judgments that affect the reported amounts of assets, liabilities, revenues and expenses, and related disclosure of contingent assets and liabilities. On an on-going basis, we evaluate our estimates, including those related to revenue recognition, bad debts, sales returns allowance, inventory, intangible and long lived assets, warranty obligations, restructure expenses, deferred taxes and freight charged to customers. We base our estimates on historical experience and on various other assumptions that we believe to be reasonable under the circumstances, the results of which form the basis for making judgments about the carrying values of assets and liabilities that are not readily apparent from other sources. Actual results may differ from these estimates under different assumptions or conditions.
We believe the following critical accounting policies are the most significant to the presentation of our consolidated financial statements:
Each sale of our equipment is evaluated on an individual basis in regard to revenue recognition. We have integrated in our evaluation the related interpretative guidance included in Topic 13 of the codification of staff accounting bulletins, and recognize the role of the EITF consensus on Issue 00-21. We first refer to EITF 00-21 in order to determine if there is more than one unit of accounting and then we refer to SAB104 for revenue recognition topics for the unit of accounting. We recognize revenue when persuasive evidence of an arrangement exists, the seller’s price is fixed or determinable and collectibility is reasonably assured.
For products produced according to our published specifications, where no installation is required or installation is deemed perfunctory and no substantive customer acceptance provisions exist, revenue is recognized when title passes to the customer, generally upon shipment. Installation is not deemed to be essential to the functionality of the equipment since installation does not involve significant changes to the features or capabilities of the equipment or the building of complex interfaces and connections. In addition, the equipment could be installed by the customer or other vendors and generally the cost of installation approximates only 1% of the sales value of the related equipment.
For products produced according to a particular customer’s specifications, revenue is recognized when the product has been tested and it has been demonstrated that it meets the customer’s specifications and title passes to the customer. The amount of revenue recorded is reduced by the amount (generally 10%), which is not payable by the customer until installation is completed and final customer acceptance is achieved.
For new products, new applications of existing products, or for products with substantive customer acceptance provisions where performance cannot be fully assessed prior to meeting customer specifications at the customer site, 100% of revenue is recognized upon completion of installation and receipt of final customer acceptance. Since title to goods generally passes to the customer upon shipment and 90% of the contract amount becomes payable at that time, inventory is relieved and accounts receivable is recorded for the entire contract amount. The revenue on these transactions is deferred and recorded as deferred revenue. As of March 31, 2005, deferred revenue as related to systems was $80. We reserve for warranty costs at the time the related revenue is recognized.
Revenue related to sales of spare parts is recognized upon shipment. Revenue related to maintenance and service contracts is recognized ratably over the duration of the contracts. Unearned maintenance and service revenue is included in deferred revenue. As of March 31, 2005, $42 of deferred revenue was related to service contracts.
Our return policy is for spare parts and components only. A right of return does not exist for systems. Customers are allowed to return spare parts if they are defective upon receipt. The potential returns are offset against gross revenue on a monthly basis. Management reviews outstanding requests for returns on a quarterly basis to determine that the reserves are adequate.
We maintain an allowance for doubtful accounts receivable for estimated losses resulting from the inability of our customers to make required payments. We consider the aging of individual customer accounts and determine, according to corporate policy, which accounts should be included in the reserve for doubtful accounts. If the financial condition of our customers were to deteriorate, or even a single customer was otherwise unable to make payments, additional allowances may be required.
Our return policy is for spare parts and components only. A right of return does not exist for systems. Customers are allowed to return spare parts if they are defective upon receipt. The potential returns are offset against gross revenue on a monthly basis. Management reviews outstanding requests for returns on a quarterly basis to determine that the reserves are adequate
Inventories are stated at the lower of cost or market, reduced by provisions for excess and obsolescence. Cost is computed using standard cost, which approximates actual cost on a first-in, first-out basis and includes material, labor and manufacturing overhead costs. We estimate the effects of excess and obsolescence on the carrying values of our inventories based upon estimates of future demand and market conditions. We establish provisions for related inventories in excess of production demand. Should actual production demand differ from our estimates, additional inventory write-downs may be required, as was the case in the third quarter of fiscal 2004. Any excess and obsolete provision is released only if and when the related inventories is sold or scrapped.
We periodically analyze any systems that are in finished goods inventory to determine if they are suitable for current customer requirements. At the present time, our policy is that, if after approximately 18 months, we determine that a sale will not take place within the next 12 months and the system would be useable for customer demonstrations or training, it is transferred to fixed assets. Otherwise, it is expensed.
The carrying value of systems used for demonstrations or training is determined by assessing the cost of the components that are suitable for sale. Any parts that may be rendered unsaleable as a result of such use are removed from the system and are not included in finished goods inventory. The remaining saleable parts are valued at the lower of cost or market, representing the system’s net realizable value. The depreciation period for systems that are transferred to fixed assets is determined based on the age of the system and its remaining useful life (typically five to eight years).
Long-lived assets are reviewed for impairment whenever events or changes in circumstances indicate that the carrying amount may not be recoverable. These indicators may include, but are not limited to, significant decreases in the market value of an asset and significant changes in the extent or manner in which an asset is used. If undiscounted expected future cash flows are less than the carrying value of the assets, an impairment loss is recognized based on the excess of the carrying amount over the fair value of the assets. No impairment charge has been recorded for the years-ended 2005, 2004 and 2003, respectively.
We provide for the estimated cost of our product warranties at the time revenue is recognized. Our warranty obligation is affected by product failure rates, material usage rates and the efficiency by which the product failure is corrected. The warranty reserve is based on historical cost data related to warranty. Should actual product failure rates, material usage rates and labor efficiencies differ from our estimates, revisions to the estimated warranty liability may be required.
During the fiscal year ended March 31, 2005, the Company recorded a severance charge of approximately $129 related to staff reductions of 19 employees, of which approximately $19 was classified as cost of sales, $18 as research and development and $92 as sales, marketing and general and administrative expenses. The Company had an outstanding severance liability of approximately $63 as of March 31, 2005.
There were no severance charges and no outstanding liability during fiscal year ended March 31, 2004.
During the fiscal year ended March 31, 2003, the Company recorded a severance charge of approximately $500 related to staff reductions of 74 employees, of which approximately $300 was classified as cost of sales, $100 as research and development and $100 as sales, marketing and general and administrative expenses.
The Company had an outstanding severance liability of approximately $75 as of March 31, 2003.
We record a valuation allowance to reduce our deferred tax assets to the amount that is more likely than not to be realized. Based on the uncertainty of future taxable income, we have fully reserved our deferred tax assets as of March 31, 2005 and 2004. In the event we were to determine that we would be able to realize our deferred tax assets in the future, an adjustment to the deferred tax asset would increase income in the period such determination was made.
Spares and systems are typically shipped “freight collect,” therefore no shipping revenue or cost is associated with the sale. When freight is charged, it is booked to revenue and offset for the cost of that freight in the cost of revenue accounts pursuant to FASB’s Emerging Issues Task Force (“EITF”) 00-10.
The following table sets forth certain financial data for the years indicated as a percentage of revenue:
| Year ended March 31, ———————————————— | |||||||||||
|---|---|---|---|---|---|---|---|---|---|---|---|
| 2005 ———— |
2004 ———— |
2003 ———— | |||||||||
| Revenue | 100 | .0% | 100 | .0% | 100 | .0% | |||||
| Cost of revenue | 78 | .1 | 71 | .9 | 100 | .5 | |||||
| Gross profit (loss) | 21 | .9 | 28 | .1 | (0 | .5) | |||||
| Operating expenses: | |||||||||||
| Research and development expenses | 38 | .8 | 20 | .0 | 34 | .2 | |||||
| Sales and marketing expenses | 19 | .5 | 14 | .2 | 20 | .7 | |||||
| General and administrative expenses | 43 | .3 | 24 | .0 | 34 | .1 | |||||
| In-process research and development | 11 | .1 | 13 | .3 | — | ||||||
| Total operating expenses | 112 | .7 | 71 | .5 | 89 | .0 | |||||
| Operating loss | (90 | .8) | (43 | .4) | (89 | .5) | |||||
| Other expense, net | (12 | .4) | (32 | .8) | — | ||||||
| Net loss | (103 | .2)% | (76 | .2)% | (89 | .5)% | |||||
Revenue
Our revenue is derived from sales of new and refurbished systems, spare parts and non-warranty service. Revenue decreased 10% in fiscal 2005 from fiscal 2004 (to $14,888 from $16,528). The revenue decrease was principally due to the higher volume of non-critical etch systems and used systems as compared to the systems sold in the previous year. Revenue increased 17% in fiscal 2004 from fiscal 2003 (to $16,528 from $14,100). The revenue increase in fiscal 2004 as compared to fiscal 2003 was principally attributable to the mix of higher priced systems and two large upgrades on critical etch tools. Spares and service sales were flat year to year.
International sales accounted for approximately 70%, 67% and 66% of total revenue in fiscal 2005, 2004 and 2003, respectively. We expect that international sales will continue to account for a significant portion of our revenue.
Gross Profit (Loss)
Our gross profit (loss) as a percentage of revenue (gross margin) decreased to 21.9% in fiscal 2005 compared to 28.1% in fiscal 2004. The gross margin decrease in fiscal 2005 as compared to fiscal 2004 was principally due to decreased revenues of $1,640, higher operations and service department expenses of $1,249 as compared to fiscal 2004. The result was higher expenses being allocated over a lower revenue base. Our gross profit (loss) as a percentage of revenue (gross margin) increased to 28.1% in fiscal 2004 compared to (0.5)% in fiscal 2003. The gross margin increase in fiscal 2004 was principally due to increased revenues of $2,428, lower operations and service department expenses of $860 and reduced inventory reserve expense of $955 as compared to fiscal 2003. The result was lower expenses being allocated over a higher revenue base.
Our gross profit as a percentage of revenue has been, and will continue to be, affected by a variety of factors, including the mix and average selling prices of systems sold and the costs to manufacture, service and support new product introductions and enhancements. Gross margins for our 6500 series systems are typically lower than those of our more mature 900 series systems due to the inefficiencies and lower vendor discounts associated with lower order volumes and increased service, installation and warranty support. However, gross profit improvement is one of our highest priorities. We believe that the results of our expense reduction efforts will begin to exhibit themselves in gross profit improvements, especially as our sales volume increases.
Research and Development
Research and development expenses consist primarily of salaries, prototype material and other costs associated with our research and development efforts. In absolute dollars, research and development expenses increased to $5,772 in fiscal 2005 from $3,305 in fiscal 2004. The increase in research and development spending resulted primarily from new product development efforts related to the Company’s recent acquisitions.
In absolute dollars, research and development expenses decreased to $3,305 in fiscal 2004 from $4,815 in fiscal 2003. The absolute dollar decrease in fiscal 2004 expenses from fiscal year 2003 was due primarily to cuts in expenses within non-essential programs.
Sales and Marketing
Sales and marketing expenses primarily consist of salaries, commissions, trade show promotion and advertising expenses. In absolute dollars, sales and marketing expenses increased $558 to $2,905 in fiscal 2005 from $2,347 in fiscal 2004. As a percentage of revenue, sales and marketing expenses increased to 19.5% in fiscal 2005 from 14.2% in fiscal 2004. The absolute dollar increase in fiscal 2005 from fiscal 2004 was primarily due to increased sales personnel. In absolute dollars, sales and marketing expenses decreased to $2,347 in fiscal 2004 from $2,922 in fiscal 2003. As a percentage of revenue, sales and marketing expenses decreased to 14.2% in fiscal 2004 from 20.7% in fiscal 2003. The absolute dollar decrease in fiscal 2004 from fiscal 2003 was primarily due to our cuts in expenses, such as a reduced presence at regional trade shows and conferences and lower advertising expenses. Additionally, we have converted from direct sales to manufacturer’s representatives in some foreign markets where business is very light. Nevertheless, we believe that we have sufficient coverage in our foreign markets to ensure that we are under consideration by customers who are in a position to commit funds to capital equipment purchases.
General and Administrative
General and administrative expenses consist of salaries, legal, accounting and related administrative services and expenses associated with general management, finance, information systems, human resources and investor relation’s activities. General and administrative expenses in absolute dollars increased $2,486 to $6,459 in fiscal 2005 from $3,973 in fiscal 2004. The increase in spending during fiscal year 2005 was primarily due to legal fees associated with the filing of patent applications and litigation expenses in connection with a trade secret dispute with a competitor. Additionally, payments in both cash and warrants were paid to consultants for management consulting and related services. There have also been incremental increases in costs related to the integration of the two businesses we acquired. These costs result from additional facility costs such as rent, utilities, supplies, insurance, and costs associated with additional employees. We continue to seek improvements in productivity in all general and administrative expense areas through reduction and cross training of personnel, tighter management of outside service providers and the lowering of costs associated with being a public company.
In-Process Research & Development
The fair value underlying the $1,653 assigned to acquired in-process research and development (“IPR&D”) in the FDSI acquisition was charged to the Company’s results of operations during the quarter ended June 30, 2004, and was determined by identifying research projects in areas for which technological feasibility had not been established and there was no alternative future use. Projects in the IPR&D category are primarily certain design change improvements, software integration and hardware modifications, which are estimated to cost approximately $1 – $2 million, are approximately 50% complete, and will be completed by December 31, 2005.
The IPR&D value of $1,653 was determined by an income approach where fair value is the present value of projected free cash flows that will be generated by the products incorporating the acquired technologies under development, assuming they are successfully completed. The estimated net free cash flows generated by the products over a seven-year period were discounted at a rate of 35% in relation to the stage of completion and the technical risks associated with achieving technological feasibility. The net cash flows for such projects were based on management’s estimates of revenue, expenses and asset requirements. Any delays or failures in the completion of these projects could impact expected return on investment and future results of operations. In addition, the Company’s operating results would be adversely affected if the value of other intangible assets acquired became impaired.
All of these projects have completion risks related to functionality, architecture, performance, process technology, continued availability of key technical personnel, product reliability and software integration. To the extent that estimated completion dates are not met, the risk of competitors’ product introductions is greater and revenue opportunity may be permanently lost.
In-process Research & Development in fiscal 2004 consisted of those products obtained through acquisition that are not yet proven to be technologically feasible but have been developed to a point where there is value associated with them in relation to potential future revenue. Because technological feasibility was not yet proven and no alternative future uses are believed to exist for the in-process technologies, the assigned value of $2,202 was expensed immediately upon the date of the acquisition.
The fair value underlying the $2,202 assigned to IPR&D in the Simplus acquisition was determined by identifying research projects in areas for which technological feasibility had not been established and there was no alternative future use. Projects in the IPR&D category are certain design change improvements on the existing 150 mm and 200 mm systems and the development of a 300 mm system. The design change improvements on the existing systems is estimated to cost approximately $500 to $1 million is expected to be completed by September 30, 2005. The development of a 300 mm system is estimated to be approximately 10% complete, and to cost between $2 million and $4 million over the next two to four years, as market demand materializes.
The IPR&D value of $2,202 was determined by an income approach where fair value is the present value of projected free cash flows that will be generated by the products incorporating the acquired technologies under development, assuming they are successfully completed. The estimated net free cash flows generated by the products over a seven-year period were discounted at a rate of 32% in relation to the stage of completion and the technical risks associated with achieving technological feasibility. The net cash flows for such projects were based on management’s estimates of revenue, expenses and asset requirements. Any delays or failures in the completion of these projects could impact expected return on investment and future results of operations. In addition, our financial condition would be adversely affected if the value of other intangible assets acquired became impaired.
All of these projects have completion risks related to functionality, architecture performance, process technology availability, continued availability of key technical personnel, product reliability and availability of software support. To the extent that estimated completion dates are not met, the risk of competitors’ product introductions is greater and revenue opportunity may be permanently lost.
Other Expense, Net
Other expense, net consists principally of, interest income, interest expense and gains and losses on foreign exchange. We recorded net non-operating expense of $1,841 in fiscal 2005 and $5,422 in fiscal 2004. In fiscal 2005, interest expense decreased due to the accretion of the debt discount and the amortization of the debt issuance costs related to the debenture financing of $2,019 in fiscal 2005 as compared to $5,480 in fiscal 2004.
Income Taxes
Our effective tax rate was 0% in all three fiscal years. No tax benefit was recorded for the losses incurred in fiscal 2005, 2004 and 2003 due to uncertainty related to the realization of such benefits. All deferred tax assets have been fully reserved.
Liquidity and Capital Resources
Net cash used in operations was $7,519 in fiscal 2005, due principally to a net loss of $15,363 offset by non cash expense from depreciation and amortization, additional inventory reserve, warrants issued for services rendered, non cash interest expense, and a non cash charge for acquired IPR&D related to the FDSI acquisition. Additionally, the net loss is offset by a net decrease in accounts receivable, a net increase in accounts payable offset by an increase in inventory and a decrease in warranty reserve, accrued liabilities, and deferred revenue.
Net capital expenditures totaled $315, $254 and $479, in fiscal 2005, 2004 and 2003, respectively. Capital expenditures in all three years were incurred principally for demonstration equipment, leasehold improvements and to acquire design tools, analytical equipment and computers. Fiscal 2003 investing activities also included $184 of cash transaction costs related to the SFI acquisition, net of cash acquired.
Cash proceeds from financing activities totaled $7,904 for fiscal 2005 and were primarily from the sale of stock and the exercise of common stock warrants by service providers and debenture holders partially offset by repayment of the domestic and Japanese lines of credit. Cash proceeds from financing activities totaled $9,734 for fiscal 2004 and were primarily from the sale of debentures and the subsequent exercise of common stock warrants by service providers and debenture holders and borrowing on the domestic and Japanese lines of credit.
On February 11, 2004, the Company signed a $25 million equity facility with Kingsbridge Capital, a firm that specializes in the financing of small to medium sized technology-based companies. The arrangement allowed the Company to sell shares of its common stock to Kingsbridge at its sole discretion over a 24-month period on a “when and if needed” basis. Kingsbridge was required under the terms of the arrangement to purchase Tegal’s stock following the effectiveness of a registration statement. The price of the common shares issued under the agreement was based on a discount to the volume-weighted average market price during a specified drawdown period.
During the fiscal 2005, the Company issued to Kingsbridge a total of 8,506,331 shares of its common stock. The shares were registered on Form S-3 filed with the Securities and Exchange Commission which became effective on July 7, 2005. Gross proceeds from the sale of stock were $10,380. The discount to the volume-weighted average market price was $1,153 and charged against equity as stock issuance cost. In addition to $623 in cash payments, the Company issued warrants to purchase 23,727, 21,686, 24,092 and 15,549 shares of common stock at $1.45, $1.56, $1.92 and $1.35, respectively, to advisors, in connection with the sale of stock to Kingsbridge which were charged against equity as stock issuance costs. Pursuant to our agreement, broker fees of 6% in cash and 1% of stock in the form of warrants were paid upon each drawdown of the facility. Additionally, warrants issued at the time of the agreement were held in current assets. These warrants are being amortized on a prorated basis at the time of the drawdown and also charged against equity as stock issuance costs. The Company does not anticipate any further sales of shares to Kingsbridge.
In connection with the Kingsbridge transaction, the Company issued fully vested warrants to Kingsbridge to purchase 300,000 shares of the Company’s common stock at an exercise price of $4.11 per share. The fair value of such options, which amounted to approximately $756 was capitalized as a transaction cost and included in other assets. The following variables were used to determine the fair value of such instruments under the Black-Scholes option pricing model: volatility of 114%, term of five years, risk free interest of 3.91% and underlying stock price equal to fair market value at the time of grant.
As of March 31, 2005, the Company’s Japanese subsidiary had $95 outstanding under its lines of credit which is collateralized by Japanese customer promissory notes held by such subsidiary in advance of payment on customers’ accounts receivable. The two credit lines have a total borrowing capacity of 200 million yen (approximately $1,860 at exchange rates prevailing on March 31, 2005), which are secured by Japanese customer promissory notes held by such subsidiary in advance of payment on customers’ accounts receivable. The two Japanese bank lines bear interest at Japanese prime (1.375% as of March 31, 2005) plus 0.875% and 1.5%, respectively.
Notes payable as of March 31, 2005 consisted primarily of one outstanding note to the California Trade and Commerce Agency for $64. The unsecured note from the California Trade and Commerce Agency carries an annual interest rate of 5.75% with monthly payments of approximately $5.5 per month. Although the payment deadlines are being met, the note is currently in technical default due to the merger of Sputtered Films and Tegal Corporation.
The Company also entered into a 2% convertible debenture financing during fiscal year 2004 that resulted in gross proceeds of $7,165. The terms and conditions of the 2% convertible debentures are described in Note 7 to the accompanying consolidated financial statements.
In December 2001, the Company issued warrants in conjunction with a private placement. During fiscal year 2004, 62,135 warrants were exercised in the amount of $155. None of these warrants were exercised during fiscal year 2005.
The consolidated financial statements contemplate the realization of assets and the satisfaction of liabilities in the normal course of business. The Company incurred net losses of $15,363, $12,602 and $12,625 for fiscal 2005, 2004 and 2003, respectively. The Company generated negative cash flows from operations of $7,519, $3,179 and $5,984 for fiscal 2005, 2004 and 2003, respectively. To finance its operations, the Company raised approximately $6,183 in net proceeds from the sale of 2% convertible debentures and exercise of warrants during fiscal 2004 (see Note 7 to the accompanying notes to the consolidated financial statements) and $10,380 from the issue of stock to Kingsbridge Capital in fiscal 2005. Management believes that these proceeds, combined with the effects of the consolidation of operations and continued cost containment, will be adequate to fund operations through fiscal year 2006. However, projected sales may not materialize and unforeseen costs may be incurred. If the projected sales do not materialize, the Company will need to reduce expenses further and raise additional capital through the issuance of debt or equity securities. If additional funds are raised through the issuance of preferred stock or debt, these securities could have rights, privileges or preferences senior to those of common stock, and debt covenants could impose restrictions on the Company’s operations. The sale of equity or debt could result in additional dilution to current stockholders, and such financing may not be available to the Company on acceptable terms, if at all. The consolidated financial statements do not include any adjustments relating to the recoverability and classification of recorded assets or the amount or classification of liabilities or any other adjustments that might be necessary should the Company be unable to continue as a going concern. These issues raise substantial doubt about the Company’s ability to continue as a going concern. Our independent accountants have included a going concern explanatory paragraph in their report dated May 27, 2005, included elsewhere in this Form 10-K. For more information on our capital resources, see “Risk Factors” below.
The following summarizes our contractual obligations at March 31, 2005, and the effect such obligations are expected to have on our liquidity and cash flows in future periods (in thousands).
| Contractual obligations: | Less than | After | |||||||||||||||
|---|---|---|---|---|---|---|---|---|---|---|---|---|---|---|---|---|---|
| Total ———— |
1 Year ———— |
1-3 Years ———— |
3-5 Years ———— |
5 Years ———— | |||||||||||||
| Non-cancelable capital lease obligations | $ | 26 | $ | 12 | $ | 14 | $ | — | $ | — | |||||||
| Non-cancelable operating lease obligations | 5,468 | 1,415 | 2,288 | 1,765 | — | ||||||||||||
| Notes payable and bank lines of credit, | 159 | 159 | — | — | — | ||||||||||||
| Total contractual cash obligations | $ | 5,653 | $ | 1,586 | $ | 2,302 | $ | 1,765 | $ | — | |||||||
Certain sales contracts of the Company include provisions under which customers would be indemnified by the Company in the event of, among other things, a third-party claim against the customer for intellectual property rights infringement related to the Company’s products. There are no limitations on the maximum potential future payments under these guarantees. The Company has accrued no amounts in relation to these provisions as no such claims have been made and the Company believes it has valid, enforceable rights to the intellectual property embedded in its products.
We have incurred operating losses and may not be profitable in the future; Our plans to maintain and increase liquidity may not be successful; The report of the independent registered public accounting firm includes a going concern uncertainty explanatory paragraph.
We incurred net losses of $15,363, $12,602 and $12,625 for the years-ended March 31, 2005, 2004 and 2003, respectively, and generated negative cash flows from operations of $7,519, $3,179 and $5,984 in these respective years. These factors raise substantial doubt as to our ability to continue as a going concern, and our independent registered public accounting firm has included a going concern uncertainty explanatory paragraph in their report dated May 27, 2005 which is included elsewhere in this Form 10-K. To finance its operations during 2004, the Company raised approximately $6,183 in net proceeds from the sale of 2% convertible debentures and exercise of warrants (see Note 7 to the accompanying notes to consolidated financial statements). During 2005, the Company raised $10,380 from stock issued to Kingsbridge. Management believes that these proceeds, combined with a projected increase in sales, consolidation of certain operations and continued cost containment will be adequate to fund operations through fiscal year 2006. However, these projected sales are to a limited number of new and existing customers and are based, for the most part, on internal and customer provided estimates of future demand, not firm customer orders. If the projected sales do not materialize, we will need to reduce expenses further and raise additional capital through the issuance of debt or equity securities. If additional funds are raised through the issuance of preferred stock or debt, these securities could have rights, privileges or preferences senior to those of our common stock, and debt covenants could impose restrictions on our operations. The sale of equity or debt could result in additional dilution to current stockholders, and such financing may not be available to us on acceptable terms, if at all. Failure to raise additional funds may adversely affect the Company’s ability to achieve its intended business objectives. The consolidated financial statements do not include any adjustments relating to the recoverability and classification of recorded assets or the amount or classification of liabilities or any other adjustments that might be necessary should we be unable to continue as a going concern.
The exercise of outstanding warrants, options and other rights to obtain additional shares will dilute the value of our shares of common stock.
As of March 31, 2005, there were warrants exercisable for approximately 1,606,300 shares of our common stock, advisor warrants convertible into 196,129 shares, 23,900 shares issuable as interest payment on previously issued debentures in lieu of cash and options exercisable for approximately 7,651,245 shares of our common stock. In addition, we have warrants outstanding from previous offerings for approximately 2,510,534 shares of our common stock.
The exercise of these warrants and the issuance of the common stock will result in dilution in the value of the shares of our outstanding common stock and the voting power represented thereby. In addition, the exercise price of the warrants may be lowered under the price adjustment provisions in the event of a “dilutive issuance,” that is, if we issue common stock at any time prior to their maturity at a per share price below such conversion or exercise price, either directly or in connection with the issuance of securities that are convertible into, or exercisable for, shares of our common stock. A reduction in the exercise price may result in the issuance of a significant number of additional shares upon the exercise of the warrants.
The warrants do not establish a “floor” that would limit reductions in such conversion price or exercise price. The downward adjustment of the exercise price of these warrants could result in further dilution in the value of the shares of our outstanding common stock and the voting power represented thereby.
To the extent the holders of our warrants exercise such securities and then sell the shares of our common stock they receive upon exercise, our stock price may decrease due to the additional amount of shares available in the market. The subsequent sales of these shares could encourage short sales by our stockholders and others, which could place further downward pressure on our stock price. Moreover, holders of these warrants may hedge their positions in our common stock by shorting our common stock, which could further adversely affect our stock price. The effect of these activities on our stock price could increase the number of shares issuable upon future exercises of our warrants.
Sales of substantial amounts of our shares of common stock will dilute your ownership percentage and could cause the price of our common stock to go down.
As of March 31, 2005, there were 52,843,520 shares of our common stock issued and outstanding and there were 4,207,048 shares of common stock reserved for issuance under our equity incentive and stock purchase plans. In addition, as of March 31, 2005, there were outstanding options, warrants and other rights to acquire up to approximately 11,964,208 shares of common stock. We received stockholder approval to increase the number of authorized shares of common stock to 100,000,000 shares. We may issue additional capital stock, convertible securities and/or warrants to raise capital in the future. In addition, to attract and retain key personnel, we may issue additional securities, including stock options. All of the above would result in additional dilution of the value of our common stock and the voting power represented thereby. No prediction can be made as to the effect, if any, that future sales of shares of our common stock, or the availability of shares for future sale, will have on the market price of our common stock prevailing from time to time. Sales of substantial amounts of shares of our common stock in the public market, or the perception that such sales could occur, may adversely affect the market price of our common stock and may make it more difficult for us to sell our equity securities in the future at a time and price which we deem appropriate. Public or private sales of substantial amounts of shares of our common stock by persons or entities that have exercised options and/or warrants will cause further dilution and could adversely affect the prevailing market price of the shares of our common stock.
The semiconductor industry is cyclical and may experience periodic downturns that may negatively affect customer demand for our products and result in losses such as those experienced in the past.
Our business depends upon the capital expenditures of semiconductor manufacturers, which in turn depend on the current and anticipated market demand for integrated circuits. The semiconductor industry is highly cyclical and historically has experienced periodic downturns, which often have had a detrimental effect on the semiconductor industry’s demand for semiconductor capital equipment, including etch and deposition systems manufactured by us. In response to the current prolonged industry slow-down, we have initiated a substantial cost containment program and completed a corporate-wide restructuring to preserve our cash. However, the need for continued investment in research and development, possible capital equipment requirements and extensive ongoing customer service and support requirements worldwide will continue to limit our ability to reduce expenses in response to the current downturn.
Our competitors have greater financial resources and greater name recognition than we do and therefore may compete more successfully in the semiconductor capital equipment industry than we can.
We believe that to be competitive, we will require significant financial resources in order to offer a broad range of systems, to maintain customer service and support centers worldwide and to invest in research and development. Many of our existing and potential competitors, including, among others, Applied Materials, Inc., Lam Research Corporation, Novellus and Tokyo Electron Limited, have substantially greater financial resources, more extensive engineering, manufacturing, marketing and customer service and support capabilities, larger installed bases of current generation etch, deposition and other production equipment and broader process equipment offerings, as well as greater name recognition than we do. We cannot assure you that we will be able to compete successfully against these companies in the United States or worldwide.
If we fail to meet the continued listing requirements of the NASDAQ Stock Market, our stock could be delisted.
Our stock is currently listed on The NASDAQ SmallCap Market. The NASDAQ Stock Market’s Marketplace Rules impose certain minimum financial requirements on us for the continued listing of our stock. One such requirement is the minimum bid price on our stock of $1.00 per share. Beginning in 2002, there have been periods of time during which we have been out of compliance with the $1.00 minimum bid requirements of The NASDAQ SmallCap Market.
If we are out of compliance in the future with NASDAQ listing requirements, we may take actions in order to achieve compliance, which actions may include a reverse split of our common stock. If an initial delisting decision is made by the NASDAQ’s staff, we may appeal the decision as permitted by NASDAQ rules. If we are delisted and cannot obtain listing on another major market or exchange, our stock’s liquidity would suffer, and we would likely experience reduced investor interest. Such factors may result in a decrease in our stock’s trading price. Delisting also may restrict us from issuing additional securities or securing additional financing.
We depend on sales of our advanced products to customers that may not fully adopt our product for production use.
We have designed our advanced etch and deposition products for customer applications in emerging new films, polysilicon and metal which we believe to be the leading edge of critical applications for the production of advanced semiconductor and other microelectronic devices. Revenues from the sale of our advanced etch and deposition systems accounted for 30%, 40% and 25% of total revenues in fiscal 2005, 2004 and 2003, respectively. Our advanced systems are currently being used primarily for research and development activities or low volume production. For our advanced systems to achieve full market adoption, our customers must utilize these systems for volume production. There can be no assurance that the market for devices incorporating emerging films, polysilicon or metal will develop as quickly or to the degree we expect.
If our advanced systems do not achieve significant sales or volume production due to a lack of full customer adoption, our business, financial condition, results of operations and cash flows will be materially adversely affected.
Our potential customers may not adopt our products because of their significant cost or because our potential customers are already using a competitor’s tool.
A substantial investment is required to install and integrate capital equipment into a semiconductor production line. Additionally, we believe that once a device manufacturer has selected a particular vendor’s capital equipment, that manufacturer generally relies upon that vendor’s equipment for that specific production line application and, to the extent possible, subsequent generations of that vendor’s systems. Accordingly, it may be extremely difficult to achieve significant sales to a particular customer once that customer has selected another vendor’s capital equipment unless there are compelling reasons to do so, such as significant performance or cost advantages. Any failure to gain access and achieve sales to new customers will adversely affect the successful commercial adoption of our products and could have a detrimental effect on us.
Our revenue and operating results have fluctuated and are likely to continue to fluctuate significantly from quarter to quarter, and there can be no assurance as to future profitability.
Our 900 series etch systems typically sell for prices ranging between $250 and $600, while prices of our 6500 series critical etch systems and our Endeavor deposition system typically range between $1.8 million and $3.0 million. To the extent we are successful in selling our 6500 and Endeavor series systems, the sale of a small number of these systems will probably account for a substantial portion of revenue in future quarters, and a transaction for a single system could have a substantial impact on revenue and gross margin for a given quarter.
Other factors that could affect our quarterly operating results include:
• |
our timing of new systems and technology announcements and releases and ability to transition between product versions; |
• |
seasonal fluctuations in sales; |
• |
changes in the mix of our revenues represented by our various products and customers; |
• |
adverse changes in the level of economic activity in the United States or other major economies in which we do business; |
• |
foreign currency exchange rate fluctuations; |
• |
expenses related to, and the financial impact of, possible acquisitions of other businesses; and |
• |
changes in the timing of product orders due to unexpected delays in the introduction of our customers' products, due to lifecycles of our customers' products ending earlier than expected or due to market acceptance of our customers' products. |
Our financial performance may adversely affect the morale and performance of our personnel and our ability to hire new personnel.
Our common stock has declined in value below the exercise price of many options granted to employees pursuant to our stock option plans. Thus, the intended benefits of the stock options granted to our employees, the creation of performance and retention incentives, may not be realized. As a result, we may lose employees whom we would prefer to retain. As a result of these factors, our remaining personnel may seek employment with larger, more established companies or companies perceived as having less volatile stock prices.
Provisions in our agreements, charter documents, stockholder rights plan and Delaware law may deter takeover attempts, which could decrease the value of your shares.
Our certificate of incorporation and bylaws and Delaware law contain provisions that could make it more difficult for a third party to acquire us without the consent of our board of directors. Our board of directors has the right to issue preferred stock without stockholder approval, which could be used to dilute the stock ownership of a potential hostile acquirer. Delaware law imposes some restrictions on mergers and other business combinations between us and any holder of 15% or more of our outstanding common stock. In addition, we have adopted a stockholder rights plan that makes it more difficult for a third party to acquire us without the approval of our board of directors. These provisions apply even if the offer may be considered beneficial by some stockholders
Because technology changes rapidly, we may not be able to introduce our products in a timely enough fashion.
The semiconductor manufacturing industry is subject to rapid technological change and new system introductions and enhancements. We believe that our future success depends on our ability to continue to enhance our existing systems and their process capabilities, and to develop and manufacture in a timely manner new systems with improved process capabilities. We may incur substantial unanticipated costs to ensure product functionality and reliability early in our products’ life cycles. There can be no assurance that we will be successful in the introduction and volume manufacture of new systems or that we will be able to develop and introduce, in a timely manner, new systems or enhancements to our existing systems and processes which satisfy customer needs or achieve market adoption.
Some of our sales cycles are lengthy, exposing us to the risks of inventory obsolescence and fluctuations in operating results.
Sales of our systems depend, in significant part, upon the decision of a prospective customer to add new manufacturing capacity or to expand existing manufacturing capacity, both of which typically involve a significant capital commitment. We often experience delays in finalizing system sales following initial system qualification while the customer evaluates and receives approvals for the purchase of our systems and completes a new or expanded facility. Due to these and other factors, our systems typically have a lengthy sales cycle (often 12 to 18 months in the case of critical etch and deposition systems) during which we may expend substantial funds and management effort. Lengthy sales cycles subject us to a number of significant risks, including inventory obsolescence and fluctuations in operating results over which we have little or no control.
We may not be able to protect our intellectual property or obtain licenses for third parties’ intellectual property and therefore we may be exposed to liability for infringement or the risk that our operations may be adversely affected.
Although we attempt to protect our intellectual property rights through patents, copyrights, trade secrets and other measures, we may not be able to protect our technology adequately and competitors may be able to develop similar technology independently. Additionally, patent applications that we may file may not be issued and foreign intellectual property laws may not protect our intellectual property rights. There is also a risk that patents licensed by or issued to us will be challenged, invalidated or circumvented and that the rights granted thereunder will not provide competitive advantages to us. Furthermore, others may independently develop similar systems, duplicate our systems or design around the patents licensed by or issued to us.
Litigation could result in substantial cost and diversion of effort by us, which by itself could have a detrimental effect on our financial condition, operating results and cash flows. Further, adverse determinations in such litigation could result in our loss of proprietary rights, subject us to significant liabilities to third parties, require us to seek licenses from third parties or prevent us from manufacturing or selling our systems. In addition, licenses under third parties’ intellectual property rights may not be available on reasonable terms, if at all.
Our customers are concentrated and therefore the loss of a significant customer may harm our business.
Our top five customers accounted for 80.0%, 84.8% and 88.2% of our systems revenues in fiscal 2005, 2004 and 2003, respectively. Three customers each accounted for more than 10% of net systems sales in fiscal 2005. Although the composition of the group comprising our largest customers may vary from year to year, the loss of a significant customer or any reduction in orders by any significant customer, including reductions due to market, economic or competitive conditions in the semiconductor manufacturing industry, may have a detrimental effect on our business, financial condition, results of operations and cash flows. Our ability to increase our sales in the future will depend, in part, upon our ability to obtain orders from new customers, as well as the financial condition and success of our existing customers and the general economy, which is largely beyond our ability to control.
We are exposed to additional risks associated with international sales and operations.
International sales accounted for 70%, 67% and 66% of total revenue for fiscal 2005, 2004 and 2003, respectively. International sales are subject to certain risks, including the imposition of government controls, fluctuations in the U.S. dollar (which could increase the sales price in local currencies of our systems in foreign markets), changes in export license and other regulatory requirements, tariffs and other market barriers, political and economic instability, potential hostilities, restrictions on the export or import of technology, difficulties in accounts receivable collection, difficulties in managing representatives, difficulties in staffing and managing international operations and potentially adverse tax consequences. There can be no assurance that any of these factors will not have a detrimental effect on our operations, financial results and cash flows.
We generally attempt to offset a portion of our U.S. dollar denominated balance sheet exposures subject to foreign exchange rate remeasurement by purchasing forward currency contracts for future delivery. There can be no assurance that our future results of operations and cash flows will not be adversely affected by foreign currency fluctuations. In addition, the laws of certain countries in which our products are sold may not provide our products and intellectual property rights with the same degree of protection as the laws of the United States.
Evolving regulation of corporate governance and public disclosure may result in additional expenses and continuing uncertainty.
Changing laws, regulations and standard relating to corporate governance and public disclosure, including the Sarbanes-Oxley Act of 2002, new SEC regulations and NASDAQ Market rules are creating uncertainty for public companies. We continually evaluate and monitor developments with respect to new and proposed rules and cannot predict or estimate the amount of the additional costs we may incur or the timing of such costs. These new or changed laws, regulations and standards are subject to varying interpretations, in many cases due to their lack of specificity, and as a result, their application in practice may evolve over time as new guidance is provided by regulatory and governing bodies. This could result in continuing uncertainty regarding compliance matters and higher costs necessitated by ongoing revisions to disclosure and governance practices. We are committed to maintaining high standards of corporate governance and public disclosure. As a result, we have invested resources to comply with evolving laws, regulations and standards, and this investment may result in increased general and administrative expenses and a diversion of management time and attention from revenue-generating activities to compliance activities. If our efforts to comply with new or changed laws, regulations and standards differ from the activities intended by regulatory or governing bodies due to ambiguities related to practice, regulatory authorities may initiate legal proceedings against us and we may be harmed.
We must integrate the technology and products we acquired from Simplus Systems Corporation and First Derivative Systems, Inc., and we may need to make additional future acquisitions to remain competitive. The process of identifying, acquiring and integrating future acquisitions may constrain valuable management resources, and our failure to effectively integrate future acquisitions may result in the loss of key employees and the dilution of stockholder value and have an adverse effect on our operating results.
On November 11, 2003, we acquired substantially all of the assets of Simplus Systems Corporation and on May 28, 2004, we purchased substantially all of the assets and assumed certain liabilities of First Derivative Systems, Inc. (“FDSI”). We may in the future seek to acquire or invest in additional businesses, products or technologies that we believe could complement or expand our business, augment our market coverage, enhance our technical capabilities or that may otherwise offer growth opportunities. We may encounter problems with the assimilation of Simplus, FDSI or businesses, products or technologies acquired in the future including:
• |
difficulties in assimilation of acquired personnel, operations, technologies or products; |
• |
unanticipated costs; |
• |
diversion of management's attention from other business concerns and potential disruption of our ongoing business; |
• |
adverse effects on our existing business relationships with our customers; |
• |
potential patent or trademark infringement from acquired technologies; |
• |
adverse effects on our current employees and the inability to retain employees of acquired companies; |
• |
use of substantial portions of our available cash as all or a portion of the purchase price; |
• |
dilution of our current stockholders due to the issuance of additional securities as consideration for acquisitions; and |
• |
inability to complete acquired research and development projects. |
If we are unable to successfully integrate our acquired companies or to create new or enhanced products and services, we may not achieve the anticipated benefits from our acquisitions. If we fail to achieve the anticipated benefits from the acquisitions, we may incur increased expenses and experience a shortfall in our anticipated revenues and we may not obtain a satisfactory return on our investment. In addition, if a significant number of employees of acquired companies fail to remain employed with us, we may experience difficulties in achieving the expected benefits of the acquisitions.
Our stock price is volatile and could result in a material decline in the value of your investment in Tegal.
We believe that factors such as announcements of developments related to our business, fluctuations in our operating results, sales of our common stock into the marketplace, failure to meet or changes in analysts’ expectations, general conditions in the semiconductor industry or the worldwide economy, announcements of technological innovations or new products or enhancements by us or our competitors, developments in patents or other intellectual property rights, developments in our relationships with our customers and suppliers, natural disasters and outbreaks of hostilities could cause the price of our common stock to fluctuate substantially. In addition, in recent years the stock market in general, and the market for shares of small capitalization stocks in particular, have experienced extreme price fluctuations, which have often been unrelated to the operating performance of affected companies. There can be no assurance that the market price of our common stock will not experience significant fluctuations in the future, including fluctuations that are unrelated to our performance.
Potential disruption of our supply of materials required to build our systems could have a negative effect on our operations and damage our customer relationships.
Materials delays have not been significant in recent years. Nevertheless, we procure certain components and sub-assemblies included in our systems from a limited group of suppliers, and occasionally from a single source supplier. For example, we depend on MECS Corporation, a robotic equipment supplier, as the sole source for the robotic arm used in all of our 6500 series systems. We currently have no existing supply contract with MECS Corporation, and we currently purchase all robotic assemblies from MECS Corporation on a purchase order basis. Disruption or termination of certain of these sources, including our robotic sub-assembly source, could have an adverse effect on our operations and damage our relationship with our customers.
Any failure by us to comply with environmental regulations imposed on us could subject us to future liabilities.
We are subject to a variety of governmental regulations related to the use, storage, handling, discharge or disposal of toxic, volatile or otherwise hazardous chemicals used in our manufacturing process. We believe that we are currently in compliance in all material respects with these regulations and that we have obtained all necessary environmental permits generally relating to the discharge of hazardous wastes to conduct our business. Nevertheless, our failure to comply with present or future regulations could result in additional or corrective operating costs, suspension of production, alteration of our manufacturing processes or cessation of our operations.
We are exposed to financial market risks, including changes in foreign currency exchange (“FX”) rates and interest rates. To mitigate the risks associated with FX rates, we utilize derivative financial instruments. We do not use derivative financial instruments for speculative or trading purposes.
Foreign Exchange Risk
We manufacture the majority of our products in the United States; however, we service customers worldwide and thus have a cost base that is diversified over a number of European and Asian currencies as well as the U.S. dollar. This diverse base of local currency costs serves to mitigate partially the earnings effect of potential changes in value of our local currency denominated revenue. Additionally, we denominate our export sales in U.S. dollars, whenever possible.
We manage short-term exposures to changing FX rates with financial market transactions, principally through the purchase of forward FX contracts to offset the earnings and cash-flow impact of the nonfunctional currency-denominated receivables. Forward FX contracts are denominated in the same currency as the receivable being hedged, and the term of the forward FX contract matches the term of the underlying receivable. The receivables being hedged arise from trade transactions affecting us.
We do not hedge our foreign currency exposures in a manner that would entirely eliminate the effects of changes in FX rates on our operations. Accordingly, our reported revenue and results of operations have been, and may in the future be, affected by changes in the FX rates. We have utilized a sensitivity analysis for the purpose of identifying market risk in relation to underlying transactions that are sensitive to FX rates including foreign currency forward exchange contracts and nonfunctional currency denominated receivables. The net amount that is exposed to changes in foreign currency rates was evaluated against a 10% change in the value of the foreign currency versus the U.S. dollar. Based on this analysis, we believe that we are not materially sensitive to changes in foreign currency rates on our net exposed FX position. During the year ended March 31, 2005, our hedges were ineffective.
Interest Rate Risk
A 24 basis-point move in the weighted average interest rates (10% of our weighted average interest rates in 2005) affecting our floating rate financial instruments as of March 31, 2005 would have an immaterial effect on our pretax results of operations over the next fiscal year.
All of the potential changes noted above are based on sensitivity analyses performed on our balances as of March 31, 2005.
| March 31, —————— | ||||||||
|---|---|---|---|---|---|---|---|---|
| 2005 ——— |
2004 ——— | |||||||
| (In thousands, except share and per share data) | ||||||||
| ASSETS | ||||||||
| Current assets: | ||||||||
| Cash and cash equivalents | $ | 7,093 | $ | 7,049 | ||||
| Accounts receivable, net of allowances for sales returns and doubtful accounts of $533 and $270 at March 31, 2005 and 2004, respectively | 1,897 | 4,729 | ||||||
| Inventories | 5,140 | 3,719 | ||||||
| Prepaid expenses and other current assets | 641 | 905 | ||||||
| Total current assets | 14,771 | 16,402 | ||||||
| Property and equipment, net | 3,342 | 4,039 | ||||||
| Intangible assets, net | 1,796 | 1,190 | ||||||
| Other assets | 183 | 1,027 | ||||||
| Total assets | $ | 20,092 | $ | 22,658 | ||||
| LIABILITIES AND STOCKHOLDERS' EQUITY | ||||||||
| Current liabilities: | ||||||||
| Notes payable and bank lines of credit | $ | 159 | $ | 2,450 | ||||
| 2% Convertible debentures, net | — | 74 | ||||||
| Accounts payable | 3,607 | 1,645 | ||||||
| Accrued product warranty | 252 | 366 | ||||||
| Deferred revenue | 122 | 440 | ||||||
| Accrued expenses and other current liabilities | 2,575 | 2,604 | ||||||
| Total current liabilities | 6,715 | 7,579 | ||||||
| Long-term portion of capital lease obligations | 13 | 26 | ||||||
| Other long term obligations | 64 | 98 | ||||||
| Total long term liabilities | 77 | 124 | ||||||
| Total liabilities | 6,792 | 7,703 | ||||||
| Commitments and contingencies (Note 6) | ||||||||
| Stockholders' equity: | ||||||||
| Preferred stock; $0.01 par value; 5,000,000 shares authorized; none issued and outstanding | — | — | ||||||
| Common stock; $0.01 par value; 100,000,000 shares authorized; 52,843,520 and 36,583,850 shares | ||||||||
| issued and outstanding at March 31, 2005 and 2004, respectively | 528 | 366 | ||||||
| Additional paid-in capital | 99,156 | 85,376 | ||||||
| Accumulated other comprehensive income | (110 | ) | 124 | |||||
| Accumulated deficit | (86,274 | ) | (70,911 | ) | ||||
| Total stockholders' equity | 13,300 | 14,955 | ||||||
| Total liabilities and stockholders' equity | $ | 20,092 | $ | 22,658 | ||||
See accompanying notes to consolidated financial statements.
| Year Ended March 31, ——————————————— | |||||||||||
|---|---|---|---|---|---|---|---|---|---|---|---|
| 2005 ———— |
2004 ———— |
2003 ———— | |||||||||
| (In thousands, except share and per share data) | |||||||||||
| Revenue | $ | 14,888 | $ | 16,528 | $ | 14,100 | |||||
| Cost of revenue | 11,621 | 11,881 | 14,166 | ||||||||
| Gross profit (loss) | 3,267 | 4,647 | (66 | ) | |||||||
| Operating expenses: | |||||||||||
| Research and development expenses | 5,772 | 3,305 | 4,815 | ||||||||
| Sales and marketing expenses | 2,905 | 2,347 | 2,922 | ||||||||
| General and administrative expenses | 6,459 | 3,973 | 4,814 | ||||||||
| In-process research and development | 1,653 | 2,202 | — | ||||||||
| Total operating expenses | 16,789 | 11,827 | 12,551 | ||||||||
| Operating loss | (13,522 | ) | (7,180 | ) | (12,617 | ) | |||||
| Interest expense, net | (2,064 | ) | (5,521 | ) | (329 | ) | |||||
| Other income, net | 223 | 99 | 321 | ||||||||
| Total other expense, net | (1,841 | ) | (5,422 | ) | (8 | ) | |||||
| Net loss | $ | (15,363 | ) | $ | (12,602 | ) | $ | (12,625 | ) | ||
| Net loss per share: | |||||||||||
| Basic and diluted | $ | (0.33 | ) | $ | (0.56 | ) | $ | (0.82 | ) | ||
| Weighted average shares used in per share computations: | |||||||||||
| Basic and diluted | 46,879 | 22,442 | 15,311 | ||||||||
See accompanying notes to consolidated financial statements.
| Common Stock Shares ————— |
Common Stock Amount ————— |
Additional Paid-in Capital ————— |
Accumulated Other Comprehensive Income ————— |
Accumulated Deficit ————— |
Total Stock- Holders' Equity ————— |
Compre- hensive Loss ————— | |||||||||||||||||||||||||||||||
|---|---|---|---|---|---|---|---|---|---|---|---|---|---|---|---|---|---|---|---|---|---|---|---|---|---|---|---|---|---|---|---|---|---|---|---|---|---|
| (In thousands, except share and per share data) | |||||||||||||||||||||||||||||||||||||
| Balances at March 31, 2002 | 14,310,938 | 143 | 67,315 | 512 | (45,684 | ) | 22,286 | ||||||||||||||||||||||||||||||
| Common stock issued under option and | |||||||||||||||||||||||||||||||||||||
| stock purchase plans | 55,412 | 1 | 25 | — | — | 26 | |||||||||||||||||||||||||||||||
| Common stock issued for acquisition | 1,499,987 | 15 | 1,170 | — | — | 1,185 | |||||||||||||||||||||||||||||||
| Common stock issued for services | |||||||||||||||||||||||||||||||||||||
| rendered | 225,425 | 2 | 102 | — | — | 104 | |||||||||||||||||||||||||||||||
| Warrants and options to purchase common | |||||||||||||||||||||||||||||||||||||
| stock issued for services rendered | — | — | 194 | — | — | 194 | |||||||||||||||||||||||||||||||
| Net loss | — | — | — | — | (12,625 | ) | (12,625 | ) | $ | (12,625 | ) | ||||||||||||||||||||||||||
| Cumulative translation adjustment | — | — | — | (47 | ) | — | (47 | ) | (47 | ) | |||||||||||||||||||||||||||
| Total comprehensive loss | — | — | — | — | — | — | $ | (12,672 | ) | ||||||||||||||||||||||||||||
| Balances at March 31, 2003 | 16,091,762 | 161 | 68,806 | 465 | (58,309 | ) | 11,123 | ||||||||||||||||||||||||||||||
| Common stock issued under option and | |||||||||||||||||||||||||||||||||||||
| stock purchase plans | 90,269 | 1 | 68 | — | — | 69 | |||||||||||||||||||||||||||||||
| Common stock issued for acquisition | 1,499,994 | 15 | 2,327 | — | — | 2,342 | |||||||||||||||||||||||||||||||
| Restricted stock issued for services | |||||||||||||||||||||||||||||||||||||
| rendered | 158,311 | — | 332 | — | — | 332 | |||||||||||||||||||||||||||||||
| Options and warrants, issued in | |||||||||||||||||||||||||||||||||||||
| previous years, exercised for | |||||||||||||||||||||||||||||||||||||
| services rendered | 470,899 | 6 | 399 | — | — | 405 | |||||||||||||||||||||||||||||||
| Warrants and options to purchase common | |||||||||||||||||||||||||||||||||||||
| stock issued for services rendered | — | — | 756 | — | — | 756 | |||||||||||||||||||||||||||||||
| Debentures - value of Beneficial | |||||||||||||||||||||||||||||||||||||
| conversion feature | — | — | 5,190 | — | — | 5,190 | |||||||||||||||||||||||||||||||
| Debentures - fair value of warrants | |||||||||||||||||||||||||||||||||||||
| issued to investors and brokers | — | — | 1,724 | — | — | 1,724 | |||||||||||||||||||||||||||||||
| Debentures - interest & accelerated | |||||||||||||||||||||||||||||||||||||
| discount | — | — | 4,033 | — | — | 4,033 | |||||||||||||||||||||||||||||||
| Debentures - debt issuance in form of | |||||||||||||||||||||||||||||||||||||
| warrants | — | — | 784 | — | — | 784 | |||||||||||||||||||||||||||||||
| Debentures - converted to shares | 15,685,769 | 157 | (157 | ) | — | — | — | ||||||||||||||||||||||||||||||
| Debentures - interest converted to | |||||||||||||||||||||||||||||||||||||
| shares | 95,609 | 1 | (1 | ) | — | — | — | ||||||||||||||||||||||||||||||
| Debentures - investor warrants exercised | 892,497 | 9 | 437 | — | — | 446 | |||||||||||||||||||||||||||||||
| Debentures - broker warrants exercised | 1,536,605 | 15 | 522 | — | — | 537 | |||||||||||||||||||||||||||||||
| Private Institutional Offering December | |||||||||||||||||||||||||||||||||||||
| 2001 - warrants exercised | 62,135 | 1 | 156 | — | — | 157 | |||||||||||||||||||||||||||||||
| Net loss | — | — | — | — | (12,602 | ) | (12,602 | ) | $ | (12,602 | ) | ||||||||||||||||||||||||||
| Cumulative translation adjustment | — | — | — | (341 | ) | — | (341 | ) | (341 | ) | |||||||||||||||||||||||||||
| Total comprehensive loss | — | — | — | — | — | — | $ | (12,943 | ) | ||||||||||||||||||||||||||||
| Balances at March 31, 2004 | 36,583,850 | $ | 366 | $ | 85,376 | $ | 124 | $ | (70,911 | ) | $ | 14,955 | |||||||||||||||||||||||||
| Common stock issued under option and | |||||||||||||||||||||||||||||||||||||
| stock purchase plans | 89,183 | 1 | 97 | — | — | 98 | |||||||||||||||||||||||||||||||
| Common stock issued for acquisition | 1,410,632 | 14 | 2,328 | — | — | 2,342 | |||||||||||||||||||||||||||||||
| Options and Warrants issued for | |||||||||||||||||||||||||||||||||||||
| services rendered | — | — | — | — | — | — | |||||||||||||||||||||||||||||||
| Warrants and options to purchase common | |||||||||||||||||||||||||||||||||||||
| stock issued for services rendered | — | — | 339 | — | — | 339 | |||||||||||||||||||||||||||||||
| Debentures - value of Beneficial | |||||||||||||||||||||||||||||||||||||
| conversion feature | — | — | 1,811 | — | — | 1,811 | |||||||||||||||||||||||||||||||
| Debentures - interest & accelerated | |||||||||||||||||||||||||||||||||||||
| discount | — | — | — | — | — | — | |||||||||||||||||||||||||||||||
| Debentures - converted to shares | 4,785,659 | 48 | (48 | ) | — | — | — | ||||||||||||||||||||||||||||||
| Debentures - interest converted to | |||||||||||||||||||||||||||||||||||||
| shares | 39,459 | — | — | — | — | — | |||||||||||||||||||||||||||||||
| Debentures - investor & advisor | |||||||||||||||||||||||||||||||||||||
| warrants exercised | 1,426,720 | 14 | 338 | — | — | 352 | |||||||||||||||||||||||||||||||
| Private Institutional Offering December | |||||||||||||||||||||||||||||||||||||
| 2001 - warrants exercised | 1,686 | — | — | — | — | — | |||||||||||||||||||||||||||||||
| Kingsbridge | 8,506,331 | 85 | 8,915 | — | — | 9,000 | |||||||||||||||||||||||||||||||
| Net loss | — | — | — | — | (15,363 | ) | (15,363 | ) | $ | (15,363 | ) | ||||||||||||||||||||||||||
| Cumulative translation adjustment | — | — | — | (234 | ) | — | (234 | ) | (234 | ) | |||||||||||||||||||||||||||
| Total comprehensive loss | — | — | — | — | — | — | $ | (15,597 | ) | ||||||||||||||||||||||||||||
| Balances at March 31, 2005 | 52,843,520 | $ | 528 | $ | 99,156 | $ | (110 | ) | $ | (86,274 | ) | $ | 13,300 | ||||||||||||||||||||||||
See accompanying notes to consolidated financial statements.
| Year Ended March 31, ———————————————— | |||||||||||
|---|---|---|---|---|---|---|---|---|---|---|---|
| 2005 ————— |
2004 ————— |
2003 ———— | |||||||||
| (In thousands) | |||||||||||
| Cash flows from operating activities: | |||||||||||
| Net loss | $ | (15,363 | ) | $ | (12,602 | ) | $ | (12,625 | ) | ||
| Adjustments to reconcile net loss to net cash used in operating activities: | |||||||||||
| Depreciation and amortization | 1,452 | 1,338 | 1,043 | ||||||||
| In-process research and development | 1,653 | 2,202 | — | ||||||||
| Provision for doubtful accounts and sales returns allowances | 273 | 56 | (186 | ) | |||||||
| Non cash interest expense - accretion of debt discount and amortization of debt | |||||||||||
| issuance costs | 2,019 | 5,480 | — | ||||||||
| Fair value of warrants and options issued for services rendered | 381 | 332 | 143 | ||||||||
| Excess and obsolete inventory provision | 778 | 967 | 1,922 | ||||||||
| Changes in operating assets and liabilities, net of acquisitions: | |||||||||||
| Accounts receivable | 2,402 | (2,362 | ) | 363 | |||||||
| Inventories | (2,093 | ) | 2,508 | 3,406 | |||||||
| Prepaid expenses and other assets | 24 | (286 | ) | 1,004 | |||||||
| Accounts payable | 1,916 | (311 | ) | 477 | |||||||
| Accrued expenses and other current liabilities | (470 | ) | (190 | ) | (151 | ) | |||||
| Accrued product warranty | (173 | ) | (411 | ) | (581 | ) | |||||
| Customer deposits | — | (15 | ) | 15 | |||||||
| Deferred revenue | (318 | ) | 115 | (814 | ) | ||||||
| Net cash used in operating activities | (7,519 | ) | (3,179 | ) | (5,984 | ) | |||||
| Cash flows from investing activities: | |||||||||||
| Purchases of property and equipment | (315 | ) | (254 | ) | (295 | ) | |||||
| Business acquisition, net of cash acquired | — | — | (184 | ) | |||||||
| Net cash used in investing activities | (315 | ) | (254 | ) | (479 | ) | |||||
| Cash flows from financing activities: | |||||||||||
| Gross proceeds from the issuance of 2% convertible debentures | — | 7,165 | — | ||||||||
| 2% convertible debentures cash issuance costs | — | (982 | ) | — | |||||||
| Net proceeds from issuance of common stock | 10,206 | 1,613 | 21 | ||||||||
| Borrowings under notes payable and bank lines of credit | 1,303 | 2,474 | 5,590 | ||||||||
| Repayments of notes payable and bank lines of credit | (3,594 | ) | (527 | ) | (6,386 | ) | |||||
| Payments on capital lease financing | (11 | ) | (9 | ) | (45 | ) | |||||
| Net cash provided by (used in) financing activities | 7,904 | 9,734 | (820 | ) | |||||||
| Effect of exchange rates on cash and cash equivalents | (26 | ) | (164 | ) | 95 | ||||||
| Net increase (decrease) in cash and cash equivalents | 44 | 6,137 | (7,188 | ) | |||||||
| Cash and cash equivalents at beginning of year | 7,049 | 912 | 8,100 | ||||||||
| Cash and cash equivalents at end of year | $ | 7,093 | $ | 7,049 | $ | 912 | |||||
| Supplemental disclosures of cash paid during the year for: | |||||||||||
| Interest | $ | 27 | $ | 119 | $ | 581 | |||||
Supplemental Schedule of Non Cash Investing Activities (amounts in thousands, except shares):
The Company reclassified finished goods inventory of $3,698 to property and equipment during the year ended March 31, 2003 as the systems are being used for customer testing, training and demonstration purposes and the Company does not believe such equipment will be sold in the upcoming twelve months.
On August 30, 2002, the Company acquired the outstanding capital stock of Sputtered Films, Inc. Consideration totaled $1,560 and consisted of 1,499,987 shares of the Company’s common stock valued at $1,185 and transaction costs of $375. The purchase price was allocated as follows:
| Assets acquired: | |||||
| Current assets | $ | 708 | |||
| Fixed assets | 824 | ||||
| Technology | 782 | ||||
| Trade name | 253 | ||||
| Total assets | 2,567 | ||||
| Liabilities assumed: | |||||
| Current liabilities | (1,007 | ) | |||
| Net assets acquired | $ | 1,560 | |||
On November 11, 2003, the Company purchased certain assets and assumed certain liabilities of Simplus Systems. Consideration totaled $2,522 and consisted of 1,499,994 shares of the Company’s common stock valued at $2,310, fully vested Tegal employee stock options to purchase 58,863 shares of the Company’s common stock at an exercise price of $3.09 per share, valued at $32 and transaction costs of $180. The purchase price was allocated as follows:
| Assets acquired: | |||||
| Fixed assets | 48 | ||||
| Identifiable intangible assets | 389 | ||||
| In-process research and development | 2,202 | ||||
| Total assets | 2,639 | ||||
| Liabilities assumed: | |||||
| Current liabilities | (117 | ) | |||
| Net assets acquired | $ | 2,522 | |||
On May 28, 2004, Tegal purchased substantially all of the assets and assumed certain liabilities of First Derivative Systems, Inc. (“FDSI”), a development stage company, for 1,410,632 shares of common stock valued at $2,342, $150 in debt forgiveness, approximately $50 in assumed liabilities, and $158 in acquisition costs, pursuant to a purchase agreement dated April 28, 2004. The following table represents the allocation of the purchase price for FDSI. In estimating the fair value of assets acquired and liabilities assumed management considered various factors, including an independent appraisal.
| Fair value fixed assets acquired | $ | 111 | |||
| Non compete agreements | 203 | ||||
| Patents | 733 | ||||
| In-process research and development | 1,653 | ||||
| Debt forgiveness | (150 | ) | |||
| Assumed liabilities | (50 | ) | |||
| $ | 2,500 | ||||
See accompanying notes to consolidated financial statements.
Tegal Corporation, a Delaware corporation (“Tegal” or the “Company”), designs, manufactures, markets and services plasma etch and deposition systems that enable the production of integrated circuits (“ICs”), memory and related microelectronics devices used in personal computers, wireless voice and data telecommunications, contact-less transaction devices, radio frequency identification devices (“RFIDs”), smart cards, data storage and micro-level actuators. Etching and deposition constitute two of the principal IC and related device production process steps and each must be performed numerous times in the production of such devices.
On August 30, 2002, the Company acquired all of the outstanding common stock of Sputtered Films, Incorporated (“SFI”), a privately held California corporation. SFI is a leader in the design, manufacture and service of high performance physical vapor deposition sputtering systems for the semiconductor and semiconductor packaging industry. SFI was founded in 1967 with the development of its core technology, the S-Gun.
On November 11, 2003, the Company acquired substantially all of the assets and certain liabilities of Simplus Systems Corporation (“Simplus”), a development stage company. Simplus had developed a deposition cluster tool and certain patented processes for barrier, copper seed and high-K dielectric applications. Simplus had coined the term “nano-layer deposition” or “NLD” to describe its unique approach to MOCVD. The Company is continuing to develop these NLD processes and related tools, and is in the process of marketing them to a limited number of key customers and joint development partners.
On May 28, 2004, the Company purchased substantially all of the assets and assumed certain liabilities of First Derivative Systems, Inc. (“FDSI”). FDSI, a privately held development stage company, was founded in 1999 as a spin-off of SFI. FDSI had developed a high-throughput, low cost-of-ownership physical vapor deposition (“PVD”) system with highly differentiated technology for leading edge memory and logic device production on 200 and 300 millimeter wafers.
The consolidated financial statements contemplate the realization of assets and the satisfaction of liabilities in the normal course of business. The Company incurred net losses of $15,363, $12,602 and $12,625 for fiscal years 2005, 2004 and 2003, respectively. The Company generated negative cash flows from operations of $7,519, $3,179 and $5,984 for fiscal years 2005, 2004 and 2003, respectively. To finance its operations during 2004, the Company raised approximately $6,183 in net proceeds from the sale of 2% convertible debentures and exercise of warrants (see Note 7). During 2005, the Company raised $10,380 from stock issued to Kingsbridge. Management believes that these proceeds, combined with a projected increase in sales, consolidation of certain operations and continued cost containment will be adequate to fund operations through fiscal year 2006. However, projected sales may not materialize and unforeseen costs may be incurred. If the projected sales do not materialize, the Company will need to reduce expenses further and raise additional capital through the issuance of debt or equity securities. If additional funds are raised through the issuance of preferred stock or debt, these securities could have rights, privileges or preferences senior to those of common stock, and debt covenants could impose restrictions on the Company’s operations. The sale of equity or debt could result in additional dilution to current stockholders, and such financing may not be available to the Company on acceptable terms, if at all. The failure to raise additional funds may adversely affect the Company’s ability to achieve its intended business objectives. The consolidated financial statements do not include any adjustments relating to the recoverability and classification of recorded assets or the amount or classification of liabilities or any other adjustments that might be necessary should the Company be unable to continue as a going concern. These factors raise substantial doubt about the Company’s ability to continue as a going concern.
The consolidated financial statements include the accounts of the Company and all of its subsidiaries. Intercompany transactions and balances are eliminated in consolidation. Accounts denominated in foreign currencies are translated using the foreign currencies as the functional currencies. Assets and liabilities of foreign operations are translated to U.S. dollars at current rates of exchange and revenues and expenses are translated using weighted average rates. The effects of translating the financial statements of foreign subsidiaries into U.S. dollars are reported as accumulated other comprehensive income, a separate component of stockholders’ equity. Gains and losses from foreign currency transactions are included in the statements of operations as a separate component of other expense, net.
The preparation of financial statements in conformity with generally accepted accounting principles in the United States requires management to make estimates and assumptions that affect the reported amounts of assets and liabilities and disclosures of contingent assets and liabilities at the date of the financial statements and the reported amounts of revenues and expenses during the reporting periods. Actual results could vary from those estimates.
The Company considers all highly liquid debt instruments having a maturity of three months or less on the date of purchase to be cash equivalents.
At March 31, 2005 and 2004 all of the Company’s investments are classified as cash equivalents in the consolidated balance sheets. The investment portfolio at March 31, 2005 and 2004 is comprised of money market funds. At March 31, 2005 and 2004, the fair value of the Company’s investments approximated cost.
The carrying amount of the Company’s financial instruments, including cash and cash equivalents, accounts receivable and accounts payable, bank lines of credit, notes payable, accrued expenses and other liabilities approximates fair value due to their relatively short maturity. The Company has foreign subsidiaries, which operate and sell the Company’s products in various global markets. As a result, the Company is exposed to changes in foreign currency exchange rates. The Company utilizes hedge instruments, primarily forward contracts, to manage its exposure associated with firm third-party transactions denominated in non-functional currencies. The Company does not hold derivative financial instruments for speculative purposes. Realized and unrealized gains and losses related to forward contracts considered to be effective hedges are deferred until settlement of the hedged items. They are recognized as other gains or losses when a hedged transaction is no longer expected to occur. Realized and unrealized gains and losses on ineffective hedges are recorded to other expense, net. Foreign currency gains and losses included in other expense, net were not significant for the years ended March 31, 2005, 2004 and 2003.
At March 31, 2005, the Company had forward exchange contracts maturing at various dates throughout fiscal 2006 to exchange 146.7 million Japanese Yen into $1,400.
Financial instruments that potentially subject the Company to significant concentrations of credit risk consist primarily of temporary cash investments and accounts receivable. Substantially all of the Company’s temporary investments are invested in money market funds. The Company’s accounts receivable are derived primarily from sales to customers located in the U.S., Europe and Asia. The Company performs ongoing credit evaluations of its customers and generally requires no collateral. The Company maintains reserves for potential credit losses. Write-offs during the periods presented have been insignificant. As of March 31, 2005 two customers accounted for approximately 40% of the accounts receivable balance. As of March 31, 2004, three customers accounted for approximately 43% of the accounts receivable balance.
Inventories are stated at the lower of cost or market, reduced by provisions for excess and obsolescence. Cost is computed using standard cost, which approximates actual cost on a first-in, first-out basis and includes material, labor and manufacturing overhead costs. We estimate the effects of excess and obsolescence on the carrying values of our inventories based upon estimates of future demand and market conditions. We establish a provision for inventories in excess of production demand. Should actual production demand differ from our estimates, additional inventory provision may be required, as was the case in the third quarter of fiscal 2004. The excess and obsolete provision is only released if and when the related inventory is sold or scrapped. Inventories are net of provisions of $8,282, $7,839, and $6,679 in fiscal years 2005, 2004 and 2003 respectively.
We periodically analyze any systems that are in finished goods inventory to determine if they are suitable for current customer requirements. At the present time, our policy is that, if after approximately 18 months, we determine that a sale will not take place within the next 12 months and the system would be useable for customer demonstrations or training, it is transferred to fixed assets. Otherwise, it is expensed.
The carrying value of systems used for demonstrations or training is determined by assessing the cost of the components that are suitable for sale. Any parts that may be rendered unsaleable as a result of such use are removed from the system and are not included in finished goods inventory. The remaining saleable parts are valued at the lower of cost or market, representing the system’s net realizable value. The depreciation period for systems that are transferred to fixed assets is determined based on the age of the system and its remaining useful life (typically five to eight years).
The Company provides warranty on all system sales based on the estimated cost of product warranties at the time revenue is recognized. The warranty obligation is effected by product failure rates, material usage rates, and the efficiency by which the product failure is corrected. Should actual product failure rates, material usage rates and labor efficiencies differ from estimates, revisions to the estimated warranty liability may be required (see Note 2 to accompanying notes to the consolidated financial statements).
Property and equipment are recorded at cost. Depreciation is calculated using the straight-line method over the estimated useful lives of the assets, ranging from three to seven years. Leasehold improvements are stated at cost and are amortized using the straight-line method over the shorter of the estimated useful life of the improvements or the lease term. When assets are disposed of, the cost and related accumulated depreciation are removed from the accounts and the resulting gains or losses are included in the results of operations. The Company generally depreciates its assets over the following periods:
| Years | |||||
|---|---|---|---|---|---|
| Furniture and machinery and equipment | 7 | ||||
| Computer and software | 3 - 5 | ||||
| Leasehold improvements | 5 or remaining lease life | ||||
Long-lived assets are reviewed for impairment whenever events or changes in circumstances indicate that the carrying amount may not be recoverable. If undiscounted expected future cash flows are less than the carrying value of the assets, an impairment loss is recognized based on the excess of the carrying amount over the fair value of the assets. No impairment charge has been recorded for the years-ended 2005, 2004 and 2003, respectively.
The Company maintains an allowance for doubtful accounts receivable for estimated losses resulting from the inability of the Company’s customers to make required payments. If the financial condition of the Company’s customers were to deteriorate, or even a single customer was otherwise unable to make payments, additional allowances may be required.
The Company’s return policy is for spare parts and components only. A right of return does not exist for systems. Customers are allowed to return spare parts if they are defective upon receipt. The potential returns are offset against gross revenue on a monthly basis. Management reviews outstanding requests for returns on a quarterly basis to determine that the reserves are adequate.
Each sale of our equipment is evaluated on an individual basis in regard to revenue recognition. We have integrated in our evaluation the related interpretative guidance included in Topic 13 of the codification of staff accounting bulletins, and recognize the role of the EITF consensus on Issue 00-21. We first refer to EITF 00-21 in order to determine if there is more than one unit of accounting and then we refer to SAB104 for revenue recognition topics for the unit of accounting. We recognize revenue when persuasive evidence of an arrangement exists, the seller’s price is fixed or determinable and collectibility is reasonably assured.
For products produced according to our published specifications, where no installation is required or installation is deemed perfunctory and no substantive customer acceptance provisions exist, revenue is recognized when title passes to the customer, generally upon shipment. Installation is not deemed to be essential to the functionality of the equipment since installation does not involve significant changes to the features or capabilities of the equipment or the building of complex interfaces and connections. In addition, the equipment could be installed by the customer or other vendors and generally the cost of installation approximates only 1% of the sales value of the related equipment.
For products produced according to a particular customer’s specifications, revenue is recognized when the product has been tested and it has been demonstrated that it meets the customer’s specifications and title passes to the customer. The amount of revenue recorded is reduced by the amount (generally 10%), which is not payable by the customer until installation is completed and final customer acceptance is achieved.
For new products, new applications of existing products, or for products with substantive customer acceptance provisions where performance cannot be fully assessed prior to meeting customer specifications at the customer site, 100% of revenue is recognized upon completion of installation and receipt of final customer acceptance. Since title to goods generally passes to the customer upon shipment and 90% of the contract amount becomes payable at that time, inventory is relieved and accounts receivable is recorded for the entire contract amount. The revenue on these transactions is deferred and recorded as deferred revenue. As of March 31, 2005, deferred revenue as related to systems was $80. We reserve for warranty costs at the time the related revenue is recognized.
Revenue related to sales of spare parts is recognized upon shipment. Revenue related to maintenance and service contracts is recognized ratably over the duration of the contracts. Unearned maintenance and service revenue is included in deferred revenue. As of March 31, 2005, $42 of deferred revenue was related to service contracts.
Our return policy is for spare parts and components only. A right of return does not exist for systems. Customers are allowed to return spare parts if they are defective upon receipt. The potential returns are offset against gross revenue on a monthly basis. Management reviews outstanding requests for returns on a quarterly basis to determine that the reserves are adequate.
Deferred income taxes are recognized for the differences between the tax bases of assets and liabilities and their financial reporting amounts based on enacted tax rates. Valuation allowances are established when necessary to reduce deferred tax assets to the amount expected to be realized.
Basic earnings per share (“EPS”) is computed by dividing net income (loss) available to common stockholders by the weighted average number of common shares outstanding during the period. Diluted EPS is computed using the weighted average number of common shares outstanding plus any potentially dilutive securities, except when the effect of including such changes is antidilutive.
The Company accounts for stock-based compensation using the intrinsic value method prescribed in Accounting Principles Board Opinion No. 25, “Accounting for Stock Issued to Employees,” and related interpretations, including FASB Interpretation No. 44 (“FIN 44”), “Accounting for Certain Transactions Involving Stock Compensation — an interpretation of APB Opinion No. 25.” The Company’s policy is to grant options with an exercise price equal to the closing market price of the Company’s stock on the grant date. Accordingly, no compensation cost for stock option grants has been recognized in the Company’s statements of operations. Additional proforma disclosures assuming the Company applied the fair value method of accounting for employee stock compensation under Statement of Financial Accounting Standards (“SFAS”) No. 123, “Accounting for Stock-Based Compensation” as amended by SFAS No. 148, “Accounting for Stock-Based Compensation – Transition and Disclosure” are as follows.
As required by SFAS No. 123 for proforma disclosure purposes only, the Company has calculated the estimated grant date fair value of its stock option awards using the Black-Scholes model. The Black-Scholes model, as well as other currently accepted option valuation models, was developed to estimate the fair value of freely tradable, fully transferable options without vesting restrictions. These models also require highly subjective assumptions, including future stock price volatility and expected time until exercise, which greatly affect the calculated grant date fair value.
The following assumptions are included in the estimated grant date fair value calculations for the Company’s stock option awards and Employee Qualified Stock Purchase Plan (“Employee Stock Purchase Plan”):
| 2005 | 2004 | 2003 | |||||||||
|---|---|---|---|---|---|---|---|---|---|---|---|
| Expected life (years): | |||||||||||
| Stock options | 4.0 | 4.0 | 4.0 | ||||||||
| Employee stock purchase plan | 0.5 | 0.5 | 0.5 | ||||||||
| Volatility: | |||||||||||
| Stock options | 90 | % | 119 | % | 165 | % | |||||
| Employee stock purchase plan | 90 | % | 119 | % | 165 | % | |||||
| Risk-free interest rate | 2.84 | % | 2.62 | % | 2.45 | % | |||||
| Dividend yield | 0 | % | 0 | % | 0 | % | |||||
The weighted average estimated grant date fair value, as defined by SFAS No. 123, for stock option awards granted during fiscal 2005, 2004 and 2003 was $0.85, $0.90 and $0.62 per option, respectively.
The following table summarizes information with respect to stock options and warrants outstanding as of March 31, 2005 (number of shares in thousands):
| Outstanding Options as of March 31, 2005 ———————————————————————— |
Exercisable at March 31, 2005 —————————————— | ||||||||||||||||
|---|---|---|---|---|---|---|---|---|---|---|---|---|---|---|---|---|---|
| Range of Exercise Prices |
Number of Options & Warrants |
Weighted Average Exercise Price |
Weighted Average Remaining Contractual Life |
Number of Options & Warrants |
Weighted Average Exercise Price | ||||||||||||
| $0.35 — $1.50 | 7,400 | $ | 0.94 | 7.96 | 4,159 | $ | 0.82 | ||||||||||
| $1.51 — $2.14 | 1,271 | 1.74 | 6.98 | 566 | 1.65 | ||||||||||||
| $2.15 — $3.00 | 1,070 | 2.52 | 2.81 | 1,069 | 2.52 | ||||||||||||
| $3.01 — $3.25 | 571 | 3.23 | 4.39 | 571 | 3.23 | ||||||||||||
| $3.26 — $3.88 | 205 | 3.48 | 7.74 | 205 | 3.48 | ||||||||||||
| $3.89 — $4.25 | 810 | 4.20 | 6.23 | 810 | 4.20 | ||||||||||||
| $4.26 — $6.88 | 393 | 5.47 | 3.48 | 393 | 5.47 | ||||||||||||
| $6.89 — $8.00 | 65 | 7.71 | 4.88 | 65 | 7.71 | ||||||||||||
| $8.01 — $8.75 | 170 | 8.66 | 6.38 | 170 | 8.66 | ||||||||||||
| $12.00 — $12.00 | 10 | 12.00 | 1.70 | 10 | 12.00 | ||||||||||||
| $0.35 — $12.00 | 11,964 | $ | 1.84 | 6.91 | 8,018 | $ | 2.15 | ||||||||||
The weighted average estimated grant date fair values per share, as defined by SFAS No. 123, for rights granted under the employee stock purchase plan during fiscal 2005, 2004 and 2003 were $0.82, $0.35 and $0.29, respectively.
Had the Company recorded compensation costs based on the estimated grant date fair value (as defined by SFAS 123) for awards granted under its stock option plans and Employee Plan, the Company’s net loss and loss per share would have been increased to the proforma amounts below for the years ended March 31, 2005, 2004 and 2003:
| 2005 ————— |
2004 ————— |
2003 ————— | |||||||||
|---|---|---|---|---|---|---|---|---|---|---|---|
| Net loss as reported | $ | (15,363 | ) | $ | (12,602 | ) | $ | (12,625 | ) | ||
| Proforma compensation expense at fair | |||||||||||
| Value | $ | (1,244 | ) | $ | (458 | ) | $ | (285 | ) | ||
| Proforma net loss | $ | (16,607 | ) | $ | (13,060 | ) | $ | (12,910 | ) | ||
| Proforma net loss per share: | |||||||||||
| Basic and diluted | $ | (0.36 | ) | $ | (0.58 | ) | $ | (0.84 | ) | ||
Comprehensive loss is defined as the change in equity of the Company during a period from transactions and other events and circumstances excluding transactions resulting from investments by owners and distributions to owners. The primary difference between net loss and comprehensive loss for the Company is attributable to foreign currency translation adjustments. Comprehensive loss is shown in the statement of stockholders’ equity.
In December 2004 the Financial Accounting Standards Board issued SFAS No. 123R, “Share-Based Payment,” that addresses the accounting for share-based payment transactions in which an enterprise receives employee services in exchange for equity instruments of the enterprise or liabilities that are based on the fair value of the enterprise’s equity instruments or that may be settled by the issuance of such equity instruments. The statement eliminates the ability to account for share-based compensation transactions using APB Opinion No. 25, “Accounting for Stock Issued to Employees,” and requires instead that such transactions be accounted for using a fair-value-based method. The Company will be required to adopt SFAS No 123R beginning April 1, 2006. Had the Company adopted SFAS No 123R during the fiscal year ended March 31, 2005, compensation expense of approximately $1,244 would have been recognized in the consolidated statements of operations for the year ended March 31, 2005.
In November 2004 the FASB issued SFAS No. 151 “Inventory Costs – An Amendment of ARB No. 43, Chapter 4” (SFAS 151). SFAS 151 clarifies that abnormal amounts of idle facility expense freight handling costs and spoilage should be expensed as incurred and not included in overhead. Further SFAS 151 requires that allocation of fixed and production facilities overheads to conversion costs should be based on normal capacity of the production facilities. The provisions in SFAS 151 are effective for inventory costs incurred during the fiscal years beginning after June 15, 2005. The adoption of SFAS 151 by the Company will have no material impact on the consolidated financial statements.
Note 2. Balance Sheet and Statement of Operations Detail
Inventories consisted of:
| March 31, ——————————— | ||||||||
|---|---|---|---|---|---|---|---|---|
| 2005 —————— |
2004 ————— | |||||||
| Raw materials | $ | 1,044 | $ | 1,563 | ||||
| Work in process | 2,976 | 1,147 | ||||||
| Finished goods and spares | 1,120 | 1,009 | ||||||
| $ | 5,140 | $ | 3,719 | |||||
Property and equipment, net, consisted of:
| March 31, ——————————— | ||||||||
|---|---|---|---|---|---|---|---|---|
| 2005 —————— |
2004 ————— | |||||||
| Machinery and equipment | $ | 4,266 | $ | 4,347 | ||||
| Demo lab equipment | 3,489 | 4,468 | ||||||
| Computer and software | 1,436 | 1,972 | ||||||
| Leasehold improvements | 3,182 | 3,143 | ||||||
| 12,373 | 13,930 | |||||||
| Less accumulated depreciation and amortization | (9,031 | ) | (9,891 | ) | ||||
| $ | 3,342 | $ | 4,039 | |||||
Machinery and equipment at March 31, 2005 and 2004, includes approximately $56 of assets under leases that have been capitalized. Accumulated amortization for such equipment approximated $ 37 and $28, respectively.
A summary of accrued expenses and other current liabilities follows:
| March 31, ——————————— |
|||||||||||
|---|---|---|---|---|---|---|---|---|---|---|---|
| 2005 —————— |
2004 ————— | ||||||||||
| Accrued compensation costs | $ | 910 | $ | 747 | |||||||
| Income taxes payable | 502 | 500 | |||||||||
| Other | 1,163 | 1,357 | |||||||||
| $ | 2,575 | $ | 2,604 | ||||||||
Product warranty and guarantees:
The Company provides warranty on all system sales based on the estimated cost of product warranties at the time revenue is recognized. The warranty obligation is affected by product failure rates, material usage rates, and the efficiency by which the product failure is corrected. Warranty activity for the years ended March 31, 2005 and 2004 is as follows:
| Year ended March 31, ————————— | ||||||||
|---|---|---|---|---|---|---|---|---|
| 2005 ———— |
2004 ——— | |||||||
| Balance at the beginning of the period | $ | 366 | $ | 734 | ||||
| Additional warranty accruals for warranties issued during the year | 465 | 419 | ||||||
| Changes in accruals related to pre-existing warranties | — | (227 | ) | |||||
| Settlements made during the year | (579 | ) | (560 | ) | ||||
| Balance at the end of the year | $ | 252 | $ | 366 | ||||
Certain of the Company’s sales contracts include provisions under which customers would be indemnified by the Company in the event of, among other things, a third-party claim against the customer for intellectual property rights infringement related to the Company’s products. There are no limitations on the maximum potential future payments under these guarantees. The Company has accrued no amounts in relation to these provisions as no such claims have been made and the Company believes it has valid, enforceable rights to the intellectual property embedded in its products.
SFAS No. 128, “Earnings Per Share,” requires dual presentation of basic and diluted net income (loss) per share on the face of the statement of operations. Basic EPS is computed by dividing loss available to common stockholders (numerator) by the weighted average number of common shares outstanding (denominator) for the period. Diluted EPS gives effect to all dilutive potential common shares outstanding during the period. The computation of diluted EPS uses the average market prices during the period. All amounts in the following table are in thousands except per share data.
| Year Ended March 31, —————————————————— | |||||||||||
|---|---|---|---|---|---|---|---|---|---|---|---|
| 2005 ———— |
2004 ———— |
2003 ———— | |||||||||
| Basic net loss per share: | |||||||||||
| Loss available to common stockholders | $ | (15,363 | ) | $ | (12,602 | ) | $ | (12,625 | ) | ||
| Weighted average common shares outstanding | 46,879 | 22,442 | 15,311 | ||||||||
| Basic and diluted net loss per share | $ | (0.33 | ) | $ | (0.56 | ) | $ | (0.82 | ) | ||
Stock options and warrants outstanding and in the money at March 31, 2005 of 7,097,341, March 31, 2004 of 8,016,520, and March 31, 2003 of 4,739,559 were excluded from the computations of diluted net loss per share because of their anti-dilutive effect on diluted loss per share.
As of March 31, 2005, the Company’s Japanese subsidiary had $95 outstanding under its lines of credit which is collateralized by Japanese customer promissory notes held by such subsidiary in advance of payment on customers’ accounts receivable. The two credit lines have a total borrowing capacity of 200 million Yen (approximately $1,860 at exchange rates prevailing on March 31, 2005), which are secured by Japanese customer promissory notes held by such subsidiary in advance of payment on customers’ accounts receivable. The two Japanese bank lines bear interest at Japanese prime (1.375% as of March 31, 2005) plus 0.875% and 1.5%, respectively.
In addition, notes payable as of March 31, 2005 consisted of one outstanding note to the California Trade and Commerce Agency for $64. The unsecured note carries an annual interest rate of 5.75 % with monthly payments of approximately $5.5 per month. Although the payment deadlines are being met, the note is currently in technical default due to the merger of Sputtered Films and Tegal Corporation. The default could result in the California Trade and Commerce Agency calling the note, therefore, this note payable is classified as a current liability.
The weighted average interest rate for all notes payable and bank lines of credit was 4.3% in fiscal year 2005.
The components of loss before benefit for income taxes are as follows:
| Year Ended March 31, ——————————————————— | |||||||||||
|---|---|---|---|---|---|---|---|---|---|---|---|
| 2005 ——————— |
2004 ——————— |
2003 ——————— | |||||||||
| Domestic | $ | (14,478 | ) | $ | (12,396 | ) | $ | (12,090 | ) | ||
| Foreign | (885 | ) | (206 | ) | (535 | ) | |||||
| $ | (15,363 | ) | $ | (12,602 | ) | $ | (12,625 | ) | |||
The income tax provision differs from the amount computed by applying the statutory U.S. federal income tax rate as follows:
| Year Ended March 31, ————————————————— | |||||||||||
|---|---|---|---|---|---|---|---|---|---|---|---|
| 2005 ————— |
2004 ————— |
2003 ————— | |||||||||
| Income tax benefit at U.S. statutory rate | $ | (4,651 | ) | $ | (4,285 | ) | $ | (4,293 | ) | ||
| State taxes net of federal benefit | (303 | ) | (265 | ) | (419 | ) | |||||
| Utilization of foreign losses | 301 | — | 182 | ||||||||
| Deferred tax assets benefit | 4,739 | 4,367 | 4,042 | ||||||||
| Other | (86 | ) | 183 | 488 | |||||||
| Income tax provision | $ | — | $ | — | $ | — | |||||
The components of deferred taxes are as follows:
| March 31, ———————————— | ||||||||
|---|---|---|---|---|---|---|---|---|
| 2005 ————— |
2004 ————— | |||||||
| Revenue recognized for tax and deferred for book | $ | 45 | $ | 217 | ||||
| Non-deductible accruals and reserves | 4,322 | 4,414 | ||||||
| Net operating loss carryforwards | 24,356 | 19,665 | ||||||
| Tax credits | 3,004 | 3,058 | ||||||
| Uniform capitalization adjustment | 566 | 148 | ||||||
| Other | 254 | 306 | ||||||
| Total | 32,547 | 27,808 | ||||||
| Valuation allowance | (32,547 | ) | (27,808 | ) | ||||
| Net deferred tax asset | $ | — | $ | — | ||||
We have recorded no net deferred tax assets at March 31, 2005 and 2004, respectively. The Company has provided a valuation allowance of $32.5 million and $27.8 million at March 31, 2005 and March 31, 2004, respectively. The valuation allowance fully reserves all net operating loss carryforwards, credits and non-deductible accruals and reserves, for which realization of future benefit is uncertain. The realization of net operating losses may be limited due to change of ownership rules. The valuation allowance increased by $4.7 million and $4.4 million during the years ended March 31, 2005 and 2004 respectively.
At March 31, 2005, the Company had net operating loss carryforwards of approximately $66.1 million and $35.0 million, for federal and state respectively. These net operating loss carryforwards will begin to expire, if not utilized, in the year ending March 31, 2006.
At March 31, 2005, the Company also has research and experimentation credit carryforwards of $2.3 million and $1.1 million for federal and state income tax purposes, respectively. The federal research and experimentation credit carryforwards will begin to expire, if not utilized, in year 2006.
Federal and state income tax regulations impose restrictions on the utilization of net operating losses in the event of an ownership change, as defined by Section 382 of the Internal Revenue Code of 1986. Under Section 382, ownership changes may have occurred, which could limit the future availability of net operating loss carryforwards. The extent of any limitation has not been determined.
The Company has several non-cancelable operating leases and capital leases, primarily for general office, production and warehouse facilities, that expire over the next five years. Future minimum lease payments under these leases are as follows:
| Year Ending March 31, 2004 | Capital Leases |
Operating Leases | ||||||
|---|---|---|---|---|---|---|---|---|
| As of March 31, 2005 | ||||||||
| 2006 | $ | 13 | $ | 1,415 | ||||
| 2007 | 12 | 1,234 | ||||||
| 2008 | 1 | 1,054 | ||||||
| 2009 | — | 1,007 | ||||||
| 2010 | — | 758 | ||||||
| Thereafter | — | — | ||||||
| Total minimum lease payments | — | 5,468 | ||||||
| Less amount representing interest | — | |||||||
| Present value of minimum lease payments | 22 | |||||||
| Less current portion | 13 | |||||||
| Long term capital lease obligation | 9 | |||||||
Most leases provide for the Company to pay real estate taxes and other maintenance expenses. Rent expense for operating leases, net of sublease income, was $1,426, $1,007 and $1,273, during the years ended March 31, 2005, 2004 and 2003, respectively.
The Company signed a new lease agreement dated April 30, 2004 for the manufacturing and corporate office facility in Petaluma, California to occupy 57,418 square feet. The lease expires December 31, 2009.
On June 30, 2003, the Company signed definitive agreements with investors to raise up to $7,165 in a private placement of convertible debt financing to be completed in two tranches. The first tranche, which closed on June 30, 2003, involved the sale of debentures in the principal amount of $929. The Company received $424 in cash on June 30, 2003 and the remaining balance of $505 on July 1, 2003, which was recorded as an other receivable as of June 30, 2003. The closing of the second tranche, which occurred on September 9, 2003 following shareholder approval on September 8, 2003, resulted in the receipt of approximately $6,236 in gross proceeds on September 10, 2003.
The Company was required to pay a cash fee of up to 6.65% of the gross proceeds of the debentures to certain financial advisors upon the closing of the second tranche. A fee of $448 has been recorded as a debt issuance cost and was paid in September 2003. The financial advisors also were granted warrants to purchase 1,756,127 shares of the Company’s common stock at an exercise price of $0.35 per share. These warrants were valued at $1,387 using the Black-Scholes option pricing model with the following variables: stock fair value of $0.93, term of five years, volatility of 95% and risk-free interest rate of 2.5%. During fiscal year ended March 31, 2005, no financial advisors exercised their warrants, leaving advisor warrants for 196,129 shares unexercised at the end of the year.
The debentures accrued interest at the rate of 2% per annum. Both the principal and accrued interest thereon of these debentures were convertible at the rate of $0.35 per share. The principal of the debentures converted into 20,471,428 shares of the Company’s common stock. The closing prices of the Company’s common stock on June 30, 2003 and September 9, 2003, the closing dates for the first and second tranches, were $0.55 and $1.49. Therefore, a beneficial conversion feature existed which was accounted for under the provisions of EITF 00-27, Application of Issue 98-5 to Certain Convertible Instruments. A beneficial feature also existed in connection with the conversion of the interest on the debentures into shares of common stock.
As of June 30, 2004, debenture holders had converted all the debentures in the principal amount of $7,165 into 20,471,428 shares of the Company’s common stock. Of the 3,542,436 shares that were registered for payment of interest in-kind, 135,068 shares had been issued for such interest payments, and the interest obligation to the debenture holders had been satisfied in full.
In addition, the debenture holders were granted warrants to purchase 4,094,209 shares of the Company’s common stock at an exercise price of $0.50. The warrants expire after eight years. The warrants were valued using the Black-Scholes model with the following variables: fair value of common stock of $0.35 for the first tranche debentures and $0.93 for the second tranche debentures, volatility of 37% and risk-free interest rate of 2.5%. The debenture holders had exercised warrants to purchase 2,239,832 shares (plus 168,695 warrants remitted as payments for stock under a cash-less exercise provision of the warrant agreement) of the Company’s common stock. As of March 31, 2005, there remained unexercised warrants held by the debenture holders for 1,606,297 shares of the Company’s common stock.
The relative fair value of the warrants has been classified as equity with the beneficial conversion feature because it meets all the equity classification criteria of EITF 00-19, Accounting for Derivative Financial Instruments Indexed to, and Potentially Settled in, a Company’s Own Stock.
The value of the beneficial conversion feature, warrants and debt issuance costs were amortized as interest expense over the life of the debt using the effective interest method. Related interest expense for fiscal 2005 amounted to $2,019. This amount is comprised of nominal interest, amortization of beneficial conversion feature and amortization of debt issuance costs.
The debt issuance costs associated with the debentures amounted to $2,369 and are comprised of $982 in cash issuance costs and $1,387 associated with warrants issued to financial advisors. Approximately $603 of these costs were allocable to the warrants and charged to equity. The remaining balance of $1,766 was recorded as an asset and was amortized over the life of the debt. As of March 31, 2005 the debentures have been fully converted; and these costs have been fully expensed.
The following table presents the amounts originally allocated to the beneficial conversion feature and warrants and the outstanding balance of debt at March 31, 2004 after accounting for these two equity instruments and conversions (in thousands):
| First Tranche |
Second Tranche |
Total | |||||||||
|---|---|---|---|---|---|---|---|---|---|---|---|
| Debentures - principal amount | $ | 929 | $ | 6,236 | $ | 7,165 | |||||
| Beneficial conversion feature (included in equity) | (605 | ) | (4,585 | ) | (5,190 | ) | |||||
| Warrants (included in equity) | (73 | ) | (1,651 | ) | (1,724 | ) | |||||
| Conversions to common stock | (846 | ) | (3,203 | ) | (4,049 | ) | |||||
| Accretion of debt discount | 599 | 3,273 | 3,872 | ||||||||
| Net amount of 2% convertible debentures | $ | 4 | $ | 70 | $ | 74 | |||||
The value of the beneficial conversion feature, warrants and debt issuance costs was amortized as interest expense during fiscal 2005. Related interest expense for fiscal 2004 amounted to $5,480. This amount is comprised of nominal interest, amortization of beneficial conversion feature and amortization of debt issuance costs.
During fiscal 2005, the principal and interest amount of the debentures converted was $1,688, which converted into 4,825,118 shares of the Company’s common stock. All debt issuance costs were fully amortized at March 31, 2005.
First Derivative Systems, Inc:
On May 28, 2004, Tegal purchased substantially all of the assets and assumed certain liabilities of First Derivative Systems, Inc. (“FDSI”), a development stage company, for 1,410,632 shares of common stock valued at $2,342, $150 in debt forgiveness, approximately $50 in assumed liabilities, and $158 in acquisition costs,. All of the shares of common stock are subject to a registration rights agreement in which the Company has agreed to register the shares with the Securities and Exchange Commission for resale. In addition, the Company entered into employment agreements with key FDSI personnel. FDSI, a development stage company, had developed a high-throughput, low cost-of-ownership physical vapor deposition (“PVD”) system with highly differentiated technology for leading edge memory and logic device production on 200 and 300 millimeter wafers. This transaction was accounted for as a purchase of assets in accordance with EITF Issue No. 98-3, “Determining whether a nonmonetary transaction involves receipt of productive assets or of a business.”
The following table represents the allocation of the purchase price for FDSI. The purchase price of this acquisition has been allocated to the acquired assets and assumed liabilities on the basis of their fair values as of the date of the acquisition. In estimating the fair value of the assets acquired and liabilities assumed, management considered various factors, including an independent appraisal.
| Fair value fixed assets acquired | $ | 111 | |||
| Non compete agreements | 203 | ||||
| Patents | 733 | ||||
| In-process research and development | 1,653 | ||||
| Debt forgiveness | (150 | ) | |||
| Assumed liabilities | (50 | ) | |||
| $ | 2,500 | ||||
The assets will be amortized over a period of years shown on the following table:
| Fixed assets acquired | 3 to 5 years | ||||
| Non compete agreements | 3 years | ||||
| Patents | 15 years | ||||
The fair value underlying the $1,653 assigned to acquired in-process research and development (“IPR&D”) in the FDSI acquisition was charged to the Company’s results of operations during the quarter ended June 30, 2004, and was determined by identifying research projects in areas for which technological feasibility had not been established and there was no alternative future use. Projects in the IPR&D category are primarily certain design change improvements, software integration and hardware modifications, which are estimated to cost approximately $1 — $2 million, are approximately 50% complete, and will be completed by December 31, 2005.
The IPR&D value of $1,653 was determined by an income approach where fair value is the present value of projected free cash flows that will be generated by the products incorporating the acquired technologies under development, assuming they are successfully completed. The estimated net free cash flows generated by the products over a seven-year period were discounted at a rate of 35% in relation to the stage of completion and the technical risks associated with achieving technological feasibility. The net cash flows for such projects were based on management’s estimates of revenue, expenses and asset requirements. Any delays or failures in the completion of these projects could impact expected return on investment and future results of operations. In addition, the Company’s operating results would be adversely affected if the value of other intangible assets acquired became impaired.
All of these projects have completion risks related to functionality, architecture, performance, process technology, continued availability of key technical personnel, product reliability and software integration. To the extent that estimated completion dates are not met, the risk of competitors’ product introductions is greater and revenue opportunity may be permanently lost.
Simplus Systems Corporation:
On November 11, 2003, the Company acquired substantially all of the assets and certain liabilities of Simplus Systems Corporation, (“Simplus”), a development stage company. Simplus had developed a deposition cluster tool and certain processes for barrier, copper seed and high-K dielectric applications. The purchase consideration of $2,522 includes 1,499,994 shares of the Company’s common stock valued at $2,310, 58,863 fully vested employee stock options to purchase Tegal common stock at an exercise price of $3.09 per share valued at $32, and acquisition costs of $180. This transaction was accounted for as a purchase of assets in accordance with EITF Issue No. 98-3, Determining Whether a Nonmonetary Transaction Involves Receipt of Productive Assets or of a Business.
The Company completed the preliminary allocation of the purchase price of Simplus. The following table represents the preliminary allocation of the purchase price for Simplus. The purchase price of this acquisition has been allocated to the acquired assets and assumed liabilities on the basis of their fair values as of the date of the acquisition. In estimating the fair value of the assets acquired and liabilities assumed, management considered various factors, including an independent appraisal.
| Fair value fixed assets acquired | $ | 48 | |||
| Work Force | 50 | ||||
| Patents | 339 | ||||
| In-process research and development | 2,202 | ||||
| Assumed liabilities | (117 | ) | |||
| $ | 2,522 | ||||
The assets will be amortized over a period of years shown on the following table:
| Fixed assets acquired | 1 year | ||||
| Work Force | 2 years | ||||
| Patents | 5 years | ||||
The fair value underlying the $2,202 assigned to acquired in-process research and development (“IPR&D”) in the Simplus acquisition was charged to the Company’s results of operations during the quarter ended December 31, 2003 and was determined by identifying research projects in areas for which technological feasibility had not been established and there was no alternative future use. Projects in the IPR&D category are certain design change improvements on the existing 150 mm and 200 mm systems and the development of a 300 mm system. The design change improvements on the existing systems are estimated to cost approximately $500,000 to $1 million, are approximately 90% complete and will be completed by December 31, 2005. The development of a 300 mm system is estimated to be approximately 10% complete, and to cost between $2 and $4 million over the next two to four years, as market demand materializes.
The IPR&D value of $2,202 was determined by an income approach where fair value is the present value of projected free cash flows that will be generated by the products incorporating the acquired technologies under development, assuming they are successfully completed. The estimated net free cash flows generated by the products over a seven-year period were discounted at a rate of 32% in relation to the stage of completion and the technical risks associated with achieving technological feasibility. The net cash flows for such projects were based on management’s estimates of revenue, expenses and asset requirements. Any delays or failures in the completion of these projects could impact expected return on investment and future results of operations. In addition, the Company’s financial condition would be adversely affected if the value of other intangible assets acquired became impaired.
All of these projects have completion risks related to functionality, architecture performance, process technology availability, continued availability of key technical personnel, product reliability and availability of software support. To the extent that estimated completion dates are not met, the risk of competitors’ product introductions is greater and revenue opportunity may be permanently lost.
Intangibles:
As of March 31, 2005, intangible assets, net consisted of the following:
| Gross | Accumulated Amortization |
Net | |||||||||
|---|---|---|---|---|---|---|---|---|---|---|---|
| Technology | $ | 782 | $ | (253 | ) | $ | 529 | ||||
| Trade name | 253 | (82 | ) | 171 | |||||||
| Workforce & non compete agreements | 254 | (99 | ) | 155 | |||||||
| Patents | 1,072 | (131 | ) | 941 | |||||||
| Total | $ | 2,361 | $ | (565 | ) | $ | 1,796 | ||||
As of March 31, 2004, intangible assets, net consisted of the following:
| Gross | Accumulated Amortization |
Net | |||||||||
|---|---|---|---|---|---|---|---|---|---|---|---|
| Technology | $ | 782 | $ | (155 | ) | $ | 627 | ||||
| Trade name | 253 | (51 | ) | 202 | |||||||
| Workforce | 50 | (12 | ) | 38 | |||||||
| Patents | 339 | (16 | ) | 323 | |||||||
| Total | $ | 1,424 | $ | (234 | ) | $ | 1,190 | ||||
The estimated future amortization expense of intangible assets as of March 31, 2005 is as follows:
| 2006 | $ | 322 | |||
| 2007 | 314 | ||||
| 2008 | 257 | ||||
| 2009 | 224 | ||||
| 2010 | 626 | ||||
| Thereafter | 53 | ||||
| $ | 1,796 | ||||
On February 11, 2004, the Company signed a $25 million equity facility with Kingsbridge Capital, a firm that specializes in the financing of small to medium sized technology-based companies. The arrangement allowed the Company to sell shares of its common stock to Kingsbridge at its sole discretion over a 24-month period on a “when and if needed” basis. Kingsbridge Capital was required under the terms of the arrangement to purchase Tegal’s stock following the effectiveness of a registration statement. The price of the common shares issued under the agreement was based on a discount to the volume-weighted average market price during a specified drawdown period. The Company had no obligation to draw down all or any portion of the commitment.
In connection with the agreement, the Company issued fully vested warrants to Kingsbridge Capital to purchase 300,000 shares of the Company’s common stock at an exercise price of $4.11 per share. The fair value of such options, which amounted to approximately $756 was capitalized as a transaction cost. The following variables were used to determine the fair value of such instruments under the Black-Scholes option pricing model: volatility of 114%, term of five years, risk free interest of 3.91% and underlying stock price equal to fair market value at the time of grant.
During the fiscal year end March 31, 2005, the Company issued to Kingsbridge Capital, Ltd. a total of 8,506,331 shares of its common stock in connection with the Amended and Restated Common Stock Purchase Agreement dated as of May 19, 2004. Gross proceeds from the sale of stock were $10,380. The discount to the volume-weighted average market price was $1,153 that was charged against equity as stock issuance cost. In addition to $623 in cash payments, the Company issued warrants to purchase 23,727, 21,686 24,092 and 15,549 shares of common stock at $1.45, $1.56, $1.92 and $1.35 respectively, to advisors, in connection with the sale of stock to Kingsbridge which were charged against equity as stock issuance costs. Pursuant to our agreement, broker fees of 6% in cash and 1% of stock in the form of warrants were paid upon each drawdown of the facility. Additionally, warrants issued at the time of the agreement were held in current assets and have been fully amortized as of March 31, 2005 and charged against equity as stock issuance costs. The Company does not anticipate any further sales of shares to Kingsbridge under the Amended and Restated Common Stock Purchase Agreement dated as of May 19, 2004.
The selling price of the stock was negotiated as a function of market price based on a specific formula. Pursuant to C08 “CAPITAL STOCK: CAPITAL TRANSACTIONS” the discount was accounted for as a cost of capital and netted against Additional Paid in Capital. Since the transaction was related to the sale of our own common stock, it was excluded from the determination of net income.
During fiscal 2004 the Company granted 578,311 options to purchase shares of the Company’s common stock to certain non-employees. The fair value of such shares amounted to approximately $332, was recorded as an operating expense using Black Scholes model for the period of services rendered.
On October 28, 2003, the Board of Directors granted options to purchase 3,410,000 shares of the Company’s common stock at an exercise price of $1.03 per share, which was the closing price of the Company’s common stock on October 28, 2003, to certain employees and directors of the Company. On December 18, 2003, the Company granted options to purchase 500,000 shares of the Company’s common stock at an exercise price of $2.14 per share to certain employees, which was the closing price of the Company’s common stock on December 18, 2003.
In August 2002, the Company granted 62,650 options to purchase shares of the Company’s common stock at an exercise price of $0.83 to consultants for services rendered. The estimated fair value of the vested options for fiscal 2003 amounted to $7 and was recorded as an operating expense. The following variables were used to determine the fair value of such instruments under the Black-Scholes option pricing model: volatility of 85%, term of four years, risk free interest of 3.40% and underlying stock price equal to fair market value at the time of grant.
During fiscal 2003, the Company granted 225,425 shares of common stock to consultants for services rendered. The fair value of such shares, which amounted to approximately $104, was recorded as an operating expense.
In July 2002, the Company granted 125,000 warrants to purchase shares of the Company’s common stock at an exercise price of $2.00 to a financial institution in connection with establishing receivables credit facility. The fair value of such warrants, which amounted to approximately $82, was recorded as a debt offering cost and is being amortized over the two-year life of the associated line of credit. The amortization for fiscal 2003 amounted to $32 and was recorded as interest expense. The following variables were used to determine the fair value of such instruments under the Black-Scholes option pricing model: volatility of 85%, term of two years, risk free interest of 4.95% and underlying stock price equal to fair market value at the time of grant.
In September 2002, the Company granted 350,000 warrants to purchase shares of the Company’s common stock at an exercise price of $1.20 to consultants in lieu of cash payments. The fair value of such warrants, which amounted to approximately $105, was capitalized as a transaction cost under purchase accounting. The following variables were used to determine the fair value of such instruments under the Black-Scholes option pricing model: volatility of 85%, term of four years, risk free interest of 4.95% and underlying stock price equal to fair market value at the time of grant.
Pursuant to the Amended and Restated Equity Incentive Plan (“Equity Incentive Plan”), options and stock purchase rights to purchase 3,500,000 shares of common stock could be granted to management and consultants. The exercise price of options and the purchase price of stock purchase rights generally has been the fair value of the Company’s common stock on the date of grant. At the date of issuance of the stock options, all options are exercisable; however the Company has the right to repurchase any stock acquired pursuant to the exercise of stock options upon termination of employment or consulting agreement at the original exercise price for up to four years from the date the options were granted, with the repurchase rights ratably expiring over that period of time. Incentive stock options are exercisable for up to ten years from the grant date of the option. Nonqualified stock options are exercisable for up to 15 years from the grant date of the option. The Equity Incentive Plan expired in December 1999. Consequently no shares were available for issuance under the Equity Incentive Plan as of March 31, 2005.
Pursuant to the terms of the Company’s 1990 Stock Option Plan (“1990 Option Plan”), options and stock purchase rights to purchase 550,000 shares of common stock could be granted to employees of the Company or its affiliates. Incentive stock options are exercisable for a period of up to ten years from the date of grant of the option and nonqualified stock options are exercisable for a period of up to ten years and two days from the date of grant of the option. At the date of issuance of the stock options, all options are exercisable; however, the Company has the right to repurchase any stock acquired pursuant to the exercise of stock options upon termination of employment at the original exercise price for up to four years from the date the options were granted, with the repurchase rights ratably expiring over that period of time. The 1990 Option Plan expired on March 10, 2000. Consequently no shares were available for issuance under the 1990 Option Plan as of March 31, 2005.
Pursuant to the terms of the Company’s Amended 1998 Equity Participation Plan (“Equity Plan”), which was authorized as a successor plan to the Company’s Equity Incentive Plan and 1990 Option Plan, 10,000,000 shares of common stock may be granted upon the exercise of options and stock appreciation rights or upon the vesting of restricted stock awards. The exercise price of options generally will be the fair value of the Company’s common stock on the date of grant. Options are generally subject to vesting at the discretion of the Compensation Committee of the Board of Directors (the “Committee”). At the discretion of the Committee, vesting may be accelerated when the fair market value of the Company’s stock equals a certain price established by the Committee on the date of grant. Incentive stock options will be exercisable for up to ten years from the grant date of the option. Non-qualified stock options will be exercisable for a maximum term to be set by the Committee upon grant. As of March 31, 2005, 3,666,096 shares were available for issuance under the Equity Plan.
Pursuant to the terms of the Stock Option Plan for Outside Directors, as amended, (“Directors Plan”), up to 1,600,000 shares of common stock may be granted to outside directors. Under the Directors Plan, each outside director who was elected or appointed to the Board on or after September 15, 1998 shall be granted an option to purchase 50,000 shares of common stock and on each second anniversary after the applicable election or appointment shall receive an additional option to purchase 25,000 shares, provided that such outside director continues to serve as an outside director on that date. For each outside director, 1/12th of the total number of shares will vest on the first day of each calendar month following the date of Option grant, contingent upon continued service as a director. Vesting may be accelerated, at the discretion of the Board, when the fair market value of the Company’s stock equals a certain price set by the Board on the date of grant of the option. The Directors Plan allows for additional grants at the discretion of the Compensation Committee. As of March 31, 2005, 925,000 shares were available for issuance under the Directors Plan.
The following table summarizes the Company’s stock option activity for the four plans described above and weighted average exercise price within each transaction type for each of the years ended March 31, 2005, 2004 and 2003 (number of shares in thousands):
| 2005 ———————— |
2004 ———————— |
2003 ———————— | ||||||||||||||||||
|---|---|---|---|---|---|---|---|---|---|---|---|---|---|---|---|---|---|---|---|---|
| Options | Weighted
Average Exercise Price |
Options | Weighted
Average Exercise Price |
Options | Weighted Average Exercise Price | |||||||||||||||
| Options outstanding at beginning of year | 7,007 | $ | 2.05 | 3,196 | $ | 3.39 | 2,960 | $ | 3.70 | |||||||||||
| Options cancelled | (1,602 | ) | 1.18 | (497 | ) | 3.23 | (92 | ) | 3.76 | |||||||||||
| Options granted | 2,300 | 1.16 | 4,613 | 1.14 | 333 | 0.58 | ||||||||||||||
| Options exercised | (54 | ) | 0.93 | (305 | ) | 0.67 | (5 | ) | 0.24 | |||||||||||
| Options outstanding March 31 | 7,651 | $ | 1.97 | 7,007 | $ | 2.05 | 3,196 | $ | 3.39 | |||||||||||
The Company granted 158,311 shares of restricted stock from the Company’s Equity Plan to consultants during fiscal year 2004 in exchange for services rendered. For fiscal year 2005, no shares of restricted stock were granted. Non-employee awards were booked as operating expenses using Black Scholes model for the period of services rendered as required by EITF 96-18.
The Company has offered an Employee Qualified Stock Purchase Plan (“Employee Plan”) under which rights are granted to purchase shares of common stock at 85% of the lesser of the market value of such shares at the beginning of a six month offering period or at the end of that six month period. Under the Employee Plan, the Company is authorized to issue up to 1,000,000 shares of common stock. 30,100 common stock shares were purchased in fiscal 2005 and 20,208 common shares were purchased in fiscal 2004. Shares available for future purchase under the Employee Plan were 540,952 at March 31, 2005.
The Company has established a defined contribution plan that covers substantially all U.S. employees. Employee contributions of up to 4% of each U.S. employee’s compensation will be matched by the Company based upon a percentage to be determined annually by the Board. Employees may contribute up to 15% of their compensation, not to exceed a prescribed maximum amount. The Company made contributions to the plan of $15, $8 and $10 in the years ended March 31, 2005, 2004 and 2003, respectively.
On June 11, 1996, the Board adopted a Preferred Shares Rights Agreement (“Rights Agreement”) and pursuant to the Rights Agreement authorized and declared a dividend of one preferred share purchase right (“Right”) for each common share of the Company’s outstanding shares at the close of business on July 1, 1996. The Rights are designed to protect and maximize the value of the outstanding equity interests in the Company in the event of an unsolicited attempt by an acquirer to take over the Company in a manner or under terms not approved by the Board. Each Right becomes exercisable to purchase one one-hundredth of a share of Series A Junior Participating Preferred Stock at an exercise price of $45.00 upon certain circumstances associated with an unsolicited takeover attempt and expires on June 11, 2006. The Company may redeem the Rights at a price of $0.01 per Right.
Tegal operates in one segment for the manufacture, marketing and servicing of integrated circuit fabrication equipment. In accordance with SFAS No. 131 (SFAS 131) “Disclosures About Segments of an Enterprise and Related Information,” Tegal’s chief operating decision-maker has been identified as the President and Chief Executive Officer, who reviews operating results to make decisions about allocating resources and assessing performance for the entire company. All material operating units qualify for aggregation under SFAS 131 due to their identical customer base and similarities in: economic characteristics; nature of products and services; and procurement, manufacturing and distribution processes. Since Tegal operates in one segment and in one group of similar products and services, all financial segment and product line information required by SFAS 131 can be found in the consolidated financial statements.
For geographical reporting, revenues are attributed to the geographic location in which the customers’ facilities are located. Long-lived assets consist primarily of property, plant and equipment, and are attributed to the geographic location in which they are located. Net sales and long-lived assets by geographic region were as follows:
| Years Ended March 31, ———————————————— | |||||||||||
|---|---|---|---|---|---|---|---|---|---|---|---|
| 2005 ———— |
2004 ———— |
2003 ———— | |||||||||
| Revenues: | |||||||||||
| Sales to customers located in: | |||||||||||
| United States | 4,445 | $ | 5,538 | $ | 4,864 | ||||||
| Asia, excluding Japan | 1,372 | 1,241 | 1,537 | ||||||||
| Japan | 6,312 | 6,485 | 2,934 | ||||||||
| Germany | 397 | 170 | 353 | ||||||||
| Italy | 498 | 1,480 | 1,851 | ||||||||
| Europe, excluding Germany and Italy | 1,864 | 1,614 | 2,561 | ||||||||
| Total sales | $ | 14,888 | $ | 16,528 | $ | 14,100 | |||||
| March 31, ——————————— | ||||||||
|---|---|---|---|---|---|---|---|---|
| 2005 ————— |
2004 ————— | |||||||
| Long-lived assets at year-end: | ||||||||
| United States | $ | 5,112 | $ | 5,195 | ||||
| Europe | 7 | 6 | ||||||
| Japan | 16 | 15 | ||||||
| Asia, excluding Japan | 3 | 13 | ||||||
| Total long-lived assets | $ | 5,138 | $ | 5,229 | ||||
The Company’s sales are primarily to domestic and international semiconductor manufacturers. The top five customers accounted for approximately 43%, 54% and 40% of the Company’s total net revenues for the years ended March 31, 2005, 2004 and 2003, respectively. One customer accounted for 20% of the Company’s total net revenues for the year ended March 31, 2005. Three customers accounted for 17%, 15% and 12% of the Company’s total net revenues for the year ended March 31, 2004. Two customers accounted for 15% and 10% of the Company’s total net revenues for the year ended March 31, 2003.
To the Board of Directors and Stockholders of Tegal Corporation:
We have audited the accompanying consolidated balance sheet of Tegal Corporation as of March 31, 2005, and the related consolidated statements of operations, stockholders’ equity, and cash flows for the year then ended. We have also audited the information presented for the year ended March 31, 2005, in Schedule II that is listed in the index and appearing under Item 15(a)(2). These financial statements and schedule are the responsibility of the Company’s management. Our responsibility is to express an opinion on these financial statements and schedule based on our audit.
We conducted our audit in accordance with the standards of the Public Company Accounting Oversight Board (United States). Those standards require that we plan and perform the audit to obtain reasonable assurance about whether the financial statements are free of material misstatement. An audit includes examining, on a test basis, evidence supporting the amounts and disclosures in the financial statements. An audit also includes assessing the accounting principles used and significant estimates made by management, as well as evaluating the overall financial statement presentation. We believe our audit provides a reasonable basis for our opinion.
In our opinion, the consolidated financial statements referred to above present fairly, in all material respects, the financial position of Tegal Corporation as of March 31, 2005, and the results of its operations and cash flows for the year then ended, in conformity with accounting principles generally accepted in the United States of America. In addition, the information presented for the year ended March 31, 2005, in Schedule II that is listed in the index and appearing under Item 15(a)(2), presents fairly, in all material respects, the information set forth therein when read in conjunction with the March 31, 2005, financial statements.
The March 31, 2005, consolidated financial statements have been prepared assuming the Company will continue as a going concern. As discussed in Note 1, recurring losses and an inability to generate sufficient cash flows to sustain operations raises substantial doubt about the Company’s ability to continue as a going concern. Management's plans in regard to these matters are also described in Note 1. The March 31, 2005, consolidated financial statements do not include any adjustments that might result from the outcome of this uncertainty.
/s/ Moss Adams LLP
Santa Rosa, California
May 27, 2005
To the Board of Directors and Stockholders of Tegal Corporation:
In our opinion, the consolidated financial statements listed in the index appearing under Item 15(a)(1) present fairly, in all material respects, the financial position of Tegal Corporation and its subsidiaries at March 31, 2004, and the results of their operations and their cash flows for each of the two years in the period ended March 31, 2004 in conformity with accounting principles generally accepted in the United States of America. In addition, in our opinion, the financial statement schedule listed in the index appearing under Item 15(a)(2) presents fairly, in all material respects, the information set forth therein when read in conjunction with the related consolidated financial statements. These financial statements and financial statement schedule are the responsibility of the Company’s management. Our responsibility is to express an opinion on these financial statements and financial statement schedule based on our audits. We conducted our audits of these statements in accordance with the standards of the Public Company Accounting Oversight Board (United States). Those standards require that we plan and perform the audit to obtain reasonable assurance about whether the financial statements are free of material misstatement. An audit includes examining, on a test basis, evidence supporting the amounts and disclosures in the financial statements, assessing the accounting principles used and significant estimates made by management, and evaluating the overall financial statement presentation. We believe that our audits provide a reasonable basis for our opinion.
The accompanying consolidated financial statements have been prepared assuming that the Company will continue as a going concern. As discussed in Note 1 to the consolidated financial statements, the Company has suffered recurring net losses and has generated negative cash flows from operations. These factors raise substantial doubt about the Company’s ability to continue as a going concern. Management’s plans in regard to these matters are also described in Note 1. The consolidated financial statements do not include any adjustments that might result from the outcome of this uncertainty.
/s/ PricewaterhouseCoopers LLP
San Jose, California
June 25, 2004
The following table sets forth our unaudited selected financial data for each of the eight quarterly periods in the two-year period, ended March 31, 2005.
| Three Months Ended ———————————————————————————————————————————————————— | ||||||||||||||||||||||||||
|---|---|---|---|---|---|---|---|---|---|---|---|---|---|---|---|---|---|---|---|---|---|---|---|---|---|---|
| Mar. 31, 2005 ———— |
Dec. 31, 2004 ———— |
Sept. 30, 2004 ———— |
June 30 2004 ———— |
Mar. 31, 2004 ———— |
Dec. 31, 2003 ———— |
Sept. 30, 2003 ———— |
June 30 2003 ———— | |||||||||||||||||||
| (In thousands, except per share data) | ||||||||||||||||||||||||||
| Quarterly Financial Data: | ||||||||||||||||||||||||||
| Revenue | $ | 3,556 | $ | 2,903 | $ | 4,988 | $ | 3,441 | $ | 6,157 | $ | 3,276 | $ | 3,210 | $ | 3,885 | ||||||||||
| Gross profit (loss) | 40 | 526 | 1,901 | 800 | 2,673 | (55 | ) | 992 | 1,037 | |||||||||||||||||
| Net loss | (3,849 | ) | (2,688 | ) | (2,501 | ) | (6,325 | ) | (1,559 | ) | (8,119 | ) | (1,670 | ) | (1,254 | ) | ||||||||||
| Net loss per share* | ||||||||||||||||||||||||||
| Basic and diluted | (0.07 | ) | (0.06 | ) | (0.05 | ) | (0.15 | ) | (0.06 | ) | (0.35 | ) | (0.10 | ) | (0.08 | ) | ||||||||||
| * | Net loss per share is computed independently for each of the quarters presented. Therefore, the sum of the quarterly net loss per share may not equal the annual net loss per share. |
On July 9, 2004, the Company changed independent registered public accounting firms from PricewaterhouseCoopers LLP (“PwC”) to Moss Adams LLP. During the period from April 1, 2002 through July 8, 2004 when PwC served as the Company’s independent registered public accounting firm, there were no reportable events, as that term is defined in Item 304(a)(1)(v) of Regulation S-K, except for a reportable condition related to: the Company’s accounting for its 2% Convertible Debentures Due 2011 (the “2% Convertible Debentures”) together with related debt issuance costs; and the expertise of the Company’s accounting personnel with respect to generally accepted accounting principles related to complex financing and other transactions. In response to the reportable condition, the Company restated its financial results and filed an amended quarterly report on Form 10-Q/A for the quarter ended December 31, 2003 which corrected an error in the accounting for the 2% Convertible Debentures and related debt issuance costs. The restatement reflected increased interest expense, net loss, net loss per share, accumulated deficit and additional paid-in capital as well as decreased current assets. The restatement did not impact any reported revenue, operating expenses or operating loss.
Management believes that the reportable condition has been remediated. As of June 15, 2004, all of the Company’s 2% Convertible Debentures had been converted into the Company’s common stock. In addition, the Company expanded and enhanced its accounting function to include sufficient knowledge of generally accepted accounting principles related to complex financing and other transactions by adding a new certified public accountant to the Company’s accounting staff on June 15, 2004.
(a) Evaluation of Disclosure Controls and Procedures. As required by SEC Rule 13a-15(b), the Company carried out an evaluation, under the supervision and with the participation of the Company’s management, including the Company’s Chief Executive Officer and the Company’s Chief Financial Officer, of the effectiveness of the design and operation of the Company’s disclosure controls and procedures as of the end of the quarter covered by this report. The evaluation also took into account a written confirmation of a reportable condition recently provided by our independent accountants stating that they noted certain matters involving our accounting for the 2% convertible debentures and related debt issuance costs. The reportable condition arose from the accounting for our 2% convertible debentures with warrants and related measurement and recognition of beneficial conversion and warrant discounts and issuance costs. As a result of the above, the Company restated its unaudited condensed consolidated financial statements for the three and nine-month periods ended December 31, 2003 as filed on Form 10Q/A on June 25, 2004.
The reportable condition letter acknowledges that accounting for 2% convertible debentures with warrants and related measurement and recognition of beneficial conversion and warrant discounts and issuance costs requires a deep understanding of complex evolving areas of generally accepted accounting principles that are subject to interpretations and where applications of such principles requires judgment.
The reportable condition letter recommends the Company expand and enhance its accounting function to include sufficient knowledge of accounting for complex financing transactions including the convertible debenture financing referred above.
Based on their evaluation as of a date at the end of the quarter covered by this annual report on Form 10-K, the Company’s principal executive officer and principal financial officer have concluded that the Company’s disclosure controls and procedures (as defined in Rules 13a-14(c) under the Securities Exchange Act of 1934 are effective, except with respect to the reportable condition referred above.
(b) Changes in Internal Controls. There were no significant changes in the Company’s internal controls or in other factors that could significantly affect these controls subsequent to the date of their evaluation, including any corrective actions with regard to significant deficiencies and material weaknesses.
None.
The following table sets forth information regarding our directors as of March 31, 2005.
| Name | Age | Director Since |
|---|---|---|
| Edward A. Dohring | 71 | 1996 |
| Jeffrey M. Krauss | 48 | 1992 |
| Brad S. Mattson | 50 | 2005 |
| H. Duane Wadsworth | 68 | 2002 |
Edward A. Dohring has served as a director of Tegal since September 1996. From October 1994 through December 1998, he was the President of SVG Lithography Systems, Inc., a subsidiary of Silicon Valley Group, Inc. From July 1992 to October 1994 he was President of the Track Division of Silicon Valley Group, Inc. Prior to joining Silicon Valley Group, Inc., Mr. Dohring was the President of Advantage Production Technology, Inc. from 1991 to 1992, when it was sold to Genus. Mr. Dohring was a member of the Semiconductor Equipment and Materials International Board of Directors from 1977 to 1989. He currently serves on the Board of Directors of MTI and is a Trustee of the SUNY Maritime College.
Jeffrey M. Krauss has served as a director of Tegal since June 1992. Since April 2000, Mr. Krauss has been a Managing Member of Psilos Group Managers, LLC, a New York based venture capital firm, and a Managing Member of the general partner of Psilos Group Partners I, LP, Psilos Group Partners II, LP, and Psilos Group Partners II SBIC, LP, each a venture capital partnership. From 1990 until April 2000, Mr. Krauss was a general partner of the general partner of Nazem & Company III, L.P. and Nazem & Company IV, L.P., both venture capital funds. He was also a general partner of The Transatlantic Fund, a joint venture between Nazem & Company and Banque Nationale de Paris of France. Prior to joining Nazem & Company, Mr. Krauss was a corporate attorney with the law firm of Simpson Thacher & Bartlett, where he specialized in leveraged buyout transactions. He currently serves as Chairman of the Board of Quovadx, Inc and as a director of APS Healthcare, Inc., One Shield, Inc., Cohesive Technologies, Inc., Valera Pharmaceuticals, Inc. and VersaMed Corporation.
Brad S. Mattson joined Tegal as the Chairman of the Board in March 2005. Mr. Mattson is a well known executive and entrepreneur in the Semiconductor Equipment industry. Most recently Mr. Mattson was founder, CEO and Chairman of Mattson Technology where he developed the Aspen platform and Strip system, and from which he retired in 2001. Previous to that he was founder, CEO, and Chairman at Novellus Systems where he developed and introduced the Concept One system which launched the company. Prior to that Mr. Mattson held various management, marketing, and technical positions at Applied Material and LFE Corporation.. He is a member of the Board of Regents of Santa Clara University and of the Board of Directors of Semiconductor Equipment and Material International (“SEMI”), and SET, an etch R&D company. Mr. Mattson has been honored with the Entrepreneur of the Year Award in 1988, and the Distinguished Alumni Award from San Jose State University. He also holds 12 patents in various semiconductor equipment and process related areas. Mr. Mattson holds a Bachelor of Science degree in Aeronautics from San Jose State University and a Master’s degree in Finance from Santa Clara University.
H. Duane Wadsworth was appointed to the Board of Directors in November, 2002. He has served as President of Wadsworth-Pacific Manufacturing Associates, a supplier of electronics to semiconductor manufacturers, since 1963. He also serves as a director of Micro-Mechanics Ltd. (Holding), Singapore and the Semiconductor Equipment and Material International (“SEMI”) Board of Directors.
There are no family relationships between any of our directors or executive officers.
The following table sets forth information regarding our executive officers as of March 31, 2005.
| Name | Age | Position |
|---|---|---|
| Brad S. Mattson Thomas R. Mika Christine T. Hergenrother Steven Selbrede Vahan Tchakerian Andrew P. Clarke |
50 53 39 53 44 45 |
Chairman of the Board of Directors President and Chief Executive Officer Vice President and Chief Financial Officer Vice President and Chief Technology Officer Vice President, Sales and Field Operations for North America Vice President Strategic PVD Products |
Brad S. Mattson joined Tegal as the Chairman of the Board in March 2005. Mr. Mattson is a well known executive and entrepreneur in the semiconductor equipment industry. Most recently Mr. Mattson was founder, CEO and Chairman of Mattson Technology, where he developed the Aspen platform and Strip system, and from which he retired in 2001. Previous to that he was founder, CEO, and Chairman at Novellus Systems where he developed and introduced the Concept One system which launched the company. Prior to that Mr. Mattson held various management, marketing and technical positions at Applied Material and LFE Corporation. He is a member of the Board of Regents of Santa Clara University and of the Board of Directors of Semiconductor Equipment and Material International (SEMI) and SET, an etch R&D company. Mr. Mattson has been honored with the Entrepreneur of the Year Award in 1988, and the Distinguished Alumni Award from San Jose State University. He also holds 12 patents in various semiconductor equipment and process related areas. Mr. Mattson holds a Bachelor of Science degree in Aeronautics from San Jose State University and a Master’s degree in Finance from Santa Clara University.
Thomas R. Mika was appointed our President and Chief Executive Officer in March 2005. Mr. Mika has more than 25 years of senior management, finance and consulting experience. Serving on our Board of Directors of Tegal since 1992, Mr. Mika played a key role in managing the activities leading to our initial public offering in 1995. He has been head of the Compensation Committee, a member of the Audit Committee and was one of the longest serving member on our Board of Directors until his appointment as Executive Vice President & Chief Financial Officer in August 2002. Prior to becoming our Executive Vice President and Chief Financial Officer, Mr. Mika founded IMTEC, a boutique investment firm active in the management of several companies. In addition to completing multiple private equity financings, joint ventures, acquisitions and license agreements on behalf of his clients, he took senior positions with Soupmasters International, Inc., where he was its President & CEO, and Disc International, Ltd., a software firm, where he served as its Chief Executive. Mr. Mika was also a director of Metrologix, a semiconductor metrology company, from the time of its initial start-up until its sale to KLA-Tencor Corp. Prior to forming IMTEC, Mr. Mika was a managing consultant with Cresap, McCormick & Paget and a policy analyst for the National Science Foundation. He holds a Bachelor of Science degree in microbiology from the University of Illinois at Urbana-Champaign and a Master of Business Administration degree from the Harvard Graduate School of Business, where he was a Harvard University Fellow.
Christine Hergenrother was appointed our Vice President, Chief Financial Officer, Secretary and Treasurer in March 2005. Prior to that, Ms. Hergenrother served as our Director of Corporate Development since June 2004, with principal responsibility for Sarbanes-Oxley and general SEC compliance matters. Between September 2002 and March 2004, Ms. Hergenrother was the Corporate Controller of Amarin Pharmaceuticals, Inc. From February 1997 until September 2002, Ms. Hergenrother held increasingly responsible positions within the finance department of Tegal. Prior to Tegal, she was a senior accountant at Mindscape Inc. and a staff auditor at the firm of Pisenti & Brinker, LLP. Ms. Hergenrother holds a Bachelor of Science degree in Business Management from Illinois State University. Ms. Hergenrother is a member of the American Institute of Certified Public Accountants and the California Society of CPA’s.
Steven Selbrede joined Tegal as Vice President and Chief Technology Officer in May 2004. In this capacity, he is responsible for coordinating, developing and overseeing the technical direction of the corporation. Mr. Selbrede is a 27-year veteran of the semiconductor industry, most recently employed as an independent consultant, and previously holding senior Research & Development management positions with Mattson Technology, where he was employed since 1994, Watkins Johnson, Genus, Samsung and National Semiconductor. Mr. Selbrede was responsible for the development of the Mattson ICP Strip and Aspen III PECVD tools. He holds a Master’s degree in Physics from The University of Illinois and a Master’s degree in Materials Science and Engineering from Stanford University.
Vahan Tchakerian joined Tegal as Vice President of Sales and Field Operations in June 2004. From 2002 to 2004, Mr. Tchakerian was Vice President of Sales, North America for FEI Company, a leading supplier of 3D structural process management systems. In 2001, Mr. Tchakerian served as Director of Sales for SEZ America, a supplier of surface preparation equipment, and in 2000 was Vice President of Sales and Business Development for Cetec Automation. Mr. Tchakerian is a 20-year veteran of the semiconductor industry and a co-founder of Jasmine Sales Group, a manufacturer’s rep company, serving as its President from 1993 until 2000. Previously he was with Prism Technologies and DuPont Photomasks. Mr. Tchakerian holds a Bachelor of Science degree in Chemical Engineering from the University of California, Berkeley.
Andrew Clarke has been working in PVD since 1989, when he joined Sputtered Films, Inc. (“SFI”), as a physicist. He worked 10 years at SFI with the founder, his father Peter Clarke, on the development and marketing of production sputtering systems. Between 1992 and 1999, Mr. Clarke oversaw development and marketing of the Endeavor PVD cluster tool systems. In 1999, Mr. Clarke left SFI and founded First Derivative Systems, Inc. (“FDSI”), a spin-off of SFI, to develop advanced architecture PVD systems for 300-mm wafer production. His team at FDSI successfully demonstrated their 300-mm PVD system to first tier customers in 2003, resulting in their acquisition by Tegal Corporation in 2004. Since 2004, Mr. Clarke has served as director of product development and subsequently as Vice President, Strategic PVD Products. Mr. Clarke holds seven U.S. patents in sputtering technology, and has authored several papers on material science and sputtering technology. Mr. Clarke holds a Bachelor of Science degree in Physics from the University of California, Santa Barbara, has completed his graduate studies in physics at the Utah State University and was a U.S. Department of Energy Graduate Fellow.
The Audit Committee, consisting of Messrs. Dohring, Krauss (Chairman) and Wadsworth for fiscal 2005, reviews the adequacy of internal controls and the results and scope of the audit and other services provided by our independent auditors. The Audit Committee meets periodically with management and the independent auditors. The Audit Committee held seven meetings in fiscal 2005. The Board of Directors adopted an Audit Committee Charter, a copy of which is posted on our website at http//www.tegal.com. Each member of our Audit Committee meets the enhanced independence standards established by the Sarbanes-Oxley Act of 2002 and related rulemaking of the Securities and Exchange Commission (the “SEC”). The Board of Directors has further determined that Jeffrey M. Krauss, Chairman of the Audit Committee, is an “audit committee financial expert,” as such term is defined in Item 401(h) of Regulation S–K promulgated by the SEC, by virtue of his relevant experience listing in his biographical summary provided above in the section entitled “Board of Directors.”
Section 16(a) of the Exchange Act, requires our officers and directors, and persons who own more than ten percent of a registered class of our equity securities, to file reports of ownership and changes in ownership (Forms 3, 4 and 5) with the SEC. Officers, directors and greater-than-ten-percent holders are required to furnish us with copies of all such forms which they file.
To our knowledge, based solely on our review of such reports or written representations from certain reporting persons, we believe that all of the filing requirements applicable to our officers, directors, greater than 10% beneficial owners and other persons subject to Section 16 of the Exchange Act were complied with during the year ended March 31, 2005, with the exception of two Form 3 filings for Messrs. Clarke and Mattson, which were due on March 16 and March 2, 2005 but were filed on March 31 and March 30, 2005, respectively and four late Form 4 filings for Messrs. Clarke, Tchakerian, Selbrede and Mika with regard to stock options granted, which were due on March 29, 2005 for Mr. Clarke and March 15, 2005, for Messrs. Tchakerian, Selbrede and Mika, but were filed on March 31, 2005 and March 16, 2005, respectively.
We have adopted a written code of business conduct and ethics that applies to our principal executive officer, principal financial officer, principal accounting officer or controller, or persons performing similar functions. The text of our Code of Business Conduct and Ethics is posted on our website at http://www.tegal.com.
The following table shows, for the fiscal years ended March 31, 2003, 2004 and 2005, the cash compensation paid by us and our subsidiaries as well as certain other compensation paid or accrued for those years for services in all capacities to the person serving as the Chief Executive Officer during fiscal 2005 and the other three most highly compensated executive officers whose total annual salary and bonus exceeded $100,000 in fiscal 2005(the “Named Executive Officers”).
| Annual Compensation | |||||||||||||||||||||||||||||||||||||||||||||||||||||||||||
|---|---|---|---|---|---|---|---|---|---|---|---|---|---|---|---|---|---|---|---|---|---|---|---|---|---|---|---|---|---|---|---|---|---|---|---|---|---|---|---|---|---|---|---|---|---|---|---|---|---|---|---|---|---|---|---|---|---|---|---|
| Name and Principal Position | Year | Salary($) | Bonus($) | Long Term Compensation Securities Underlying Options |
All Other(1) Compensation($) | ||||||||||||||||||||||||||||||||||||||||||||||||||||||
| Michael L. Parodi | 2005 | 243,137 | — | — | 30,614 | ||||||||||||||||||||||||||||||||||||||||||||||||||||||
| Chairman of the Board, President | 2004 | 193,838 | — | 900,000 | 17,146 | ||||||||||||||||||||||||||||||||||||||||||||||||||||||
| And Chief Executive Officer+ | 2003 | 199,607 | — | — | 17,146 | ||||||||||||||||||||||||||||||||||||||||||||||||||||||
| Thomas R. Mika | 2005 | 175,049 | — | 300,000 | 7,867 | ||||||||||||||||||||||||||||||||||||||||||||||||||||||
| Chief Financial Officer and | 2004 | 131,928 | — | 600,000 | 7,351 | ||||||||||||||||||||||||||||||||||||||||||||||||||||||
| Executive Vice | 2003 | 88,166 | 4,400 | 100,000 | 1,800 | ||||||||||||||||||||||||||||||||||||||||||||||||||||||
| President/President and Chief Executive Officer+ | |||||||||||||||||||||||||||||||||||||||||||||||||||||||||||
| Steven Selbrede | 2005 | 168,505 | 20,000 | 266,500 | 429 | ||||||||||||||||||||||||||||||||||||||||||||||||||||||
| Vice President and Chief Technology | 2004 | — | — | 11,640 | — | ||||||||||||||||||||||||||||||||||||||||||||||||||||||
| Officer | 2003 | — | — | — | — | ||||||||||||||||||||||||||||||||||||||||||||||||||||||
| Vahan Tchakerian | 2005 | 156,013 | — | 317,882 | 1,951 | ||||||||||||||||||||||||||||||||||||||||||||||||||||||
| Vice President, Sales and Field | 2004 | — | — | — | — | ||||||||||||||||||||||||||||||||||||||||||||||||||||||
| Operations, North America | 2003 | — | — | — | — | ||||||||||||||||||||||||||||||||||||||||||||||||||||||
| Carole Anne Demachkie | 2005 | 108,494 | — | — | 429 | ||||||||||||||||||||||||||||||||||||||||||||||||||||||
| Vice President, General Manager | 2004 | 136,158 | 24,000 | 250,000 | 158 | ||||||||||||||||||||||||||||||||||||||||||||||||||||||
| Sputtered Films, Inc.+ | 2003 | 55,539 | — | 30,000 | 79 | ||||||||||||||||||||||||||||||||||||||||||||||||||||||
_________________
+   Mr. Parodi served as Chairman of the Board, President and Chief Executive Officer until his resignation in March 2005. Mr. Mika
    served as the Executive Vice President and Chief Financial Officer until March 2005, at which time he accepted the position as
    President and Chief Executive Officer. Carole Anne Demachkie served as Vice President and General Manager of Sputtered Films
    Division until her resignation in February 2005.

(1) Other compensation in fiscal 2005 consists of 401(k) and employer match contributions made by us, commissions paid to Mr.
    Tchakerian in the amount of $1,078, severance paid to Mr. Parodi in the amount of $14,711 and, for Messrs. Parodi, Mika and
    Tchakerian, $15,400, $7,200 and $299, respectively in car allowances paid by us.  Other compensation in fiscal 2004 consists of
    401(k) contributions made by us, and, for Messrs. Parodi and Mika, $16,800 and $7,200, respectively, in car allowances paid by
    us. Other compensation in fiscal 2003 consists of 401(k) contributions made by us and, for Mr. Parodi, $16,800 in car allowances
    paid by us.
The following table sets forth information regarding grants of stock options we granted during fiscal 2005 to the Named Executive Officers.
| Individual Grants | Potential Realizable Value at Assumed Annual Rates of Stock Price Appreciation for Option Term | |||||||||||||||||||
|---|---|---|---|---|---|---|---|---|---|---|---|---|---|---|---|---|---|---|---|---|
| Name | Number of Shares of Common Stock Underlying Option Granted |
Percentage of Total Options Granted to Employee in Fiscal Year 2005 |
Exercise or Base Price Per Share |
Expiration Date |
5% | 10% | ||||||||||||||
| Michael L. Parodi | — | — | — | — | — | — | ||||||||||||||
| Thomas R. Mika | 50,000 | 2 | % | $ | 1.03 | 3/11/15 | $ | 32,388 | $ | 82,078 | ||||||||||
| 250,000 | 11 | % | $ | 1.03 | 3/11/15 | $ | 161,940 | $ | 410,389 | |||||||||||
| Steven Selbrede | 100,000 | 5 | % | $ | 1.32 | 5/18/14 | $ | 83,014 | $ | 210,374 | ||||||||||
| 150,000 | 7 | % | $ | 1.30 | 5/18/14 | $ | 117,037 | $ | 293,516 | |||||||||||
| 16,500 | 1 | % | $ | 1.03 | 3/11/15 | $ | 10,688 | $ | 27,086 | |||||||||||
| Vahan Tchakerian | 200,000 | 9 | % | $ | 1.32 | 5/20/14 | $ | 164,536 | $ | 416,115 | ||||||||||
| 100,000 | 5 | % | $ | 1.30 | 6/15/14 | $ | 78,805 | $ | 198,067 | |||||||||||
| 17,882 | 1 | % | $ | 1.03 | 3/11/15 | $ | 11,583 | $ | 29,354 | |||||||||||
| Carole Anne Demachkie | — | — | — | — | — | — | ||||||||||||||
Our outside directors currently receive an annual $12,000 retainer for service on the Board of Directors, meeting fees of $1,500 per board meeting ($750 per meeting for special meetings held telephonically) and $1,125 per committee meeting not held in conjunction with a full board meeting ($500 per meeting for committee meetings held telephonically). Furthermore, directors may be reimbursed for certain expenses in connection with attendance at board and committee meetings. Additionally, each committee chair shall receive an annual chair retainer of $5,000 for the Audit Committee chair, $3,000 for the Compensation Committee chair and $3,000 for the Nominating Committee chair. In addition, we provide the Option Plan for Outside Directors, pursuant to which non-employee directors automatically receive an option to purchase 50,000 shares of our common stock upon such director’s initial election or appointment to our Board of Directors. In addition, each non-employee director is eligible to receive an option to purchase 25,000 shares of our common stock on the date of each annual meeting of our stockholders at which such director is re–elected to our Board of Directors.
The information set forth below shall not be deemed incorporated by reference by any general statement incorporating by reference this proxy statement into any filing under the Securities Act of 1933, as amended (the “Securities Act”), or under the Securities Exchange Act of 1934, as amended (the “Exchange Act”), except to the extent we specifically incorporate this information by reference, and shall not otherwise be deemed filed under such Acts.
The Compensation Committee of the Board of Directors has furnished the following report on executive compensation.
In formulating the executive compensation program, the Compensation Committee’s objectives were (1) to attract and retain competent executive talent and motivate executive officers to perform to the full extent of their abilities, (2) to tie a significant portion of executive compensation to the achievement of specified performance goals for Tegal, and (3) to link executive and stockholder interests through equity based plans.
The key elements of our executive compensation program consist of base salary, cash bonuses and stock options.
Each executive’s base salary is reviewed annually, but as a general rule, significant base salary increases are limited to promotions, while lesser adjustments are made as appropriate after taking into account such factors as internal equity, comparable market salaries paid to individuals of comparable responsibility and company size and increases in levels of responsibility. All salaries are based on sustained individual performance toward our goals and objectives.
The Board of Directors has approved a severance arrangement for our executive officers in the event of a change of control of Tegal. If an executive officer is terminated as a result of a change of control, we shall continue to pay such executive officer’s base salary and certain benefits for a period of 12 months.
In order to motivate executives and managers in the attainment of our annual goals and to enhance our ability to attract and retain key managerial employees through a competitive compensation package, we have adopted an annual performance bonus plan for executives and managers designated by the Chief Executive Officer and approved by the Board of Directors. Each designated position has an annual bonus incentive target expressed as a percentage of that executive’s or manager’s base salary. The attainment of the target bonus is determined by the degree to which an individual achieves specific annual objectives determined annually and reviewed and approved by the Board of Directors for all executives who report directly to the Chief Executive Officer, and by the degree to which we achieve our annual financial plan. Unless specifically directed by the Board of Directors, no bonuses are to be paid unless we realize a minimum of five percent profit before taxes as a percent of revenue. Incentives are prorated if we exceed or fall short of our annual financial plan goals, with the incentive maximums capped at 250% of target bonus amounts.
We provide long-term incentive compensation through our equity plan which generally gives the Board of Directors authority to grant stock options as well as other types of awards. Stock options are designed to align the interests of executives and key personnel with those of our stockholders. The Board of Directors believes that significant equity interests in Tegal held by our management serve to retain and motivate management.
The Board of Directors’ decision whether to grant options and the number of options is based primarily on the individual executive’s responsibility, performance and existing stock ownership. In fiscal 2005, the Board of Directors considered awards based on the Board of Directors’ assessment of the individual executive’s contribution to our success in meeting our financial goals. This assessment was based primarily on our earnings and the level of the executive’s responsibility. The awards also were based on non-financial performance measures such as individual performance, the recommendations of the Chief Executive Officer and the success in implementing our long-term strategic plan. We expect that most awards under our 1998 Equity Participation Plan will be stock options that will generally be granted with an exercise price equal to the market price of the common stock on the date of grant.
The Compensation Committee is charged with establishing the objectives and compensation of Thomas R. Mika, our Chief Executive Officer, who is responsible for our strategic and financial performance. Mr. Mika became the Chief Executive Officer in March 2005. The Compensation Committee determines our Chief Executive Officer’s compensation package based upon the general factors discussed above and upon an evaluation of compensation paid to chief executive officers at comparable public companies and other companies in our industry.
Mr. Mika’s current annual salary is $250,000 In addition, Mr. Mika is eligible to receive an amount not less than 35% of his base salary upon the achievement of certain goals established by the Board of Directors at the beginning of each fiscal year. For fiscal 2005, Mr. Mika did not receive a bonus, however, subsequent to the end of the fiscal year, the Committee did authorize the payment of a cash bonus and stock (in the form of restricted stock units) for the successful completion of a financing. The Board of Directors determines the actual bonus payable based upon the recommendation of the Compensation Committee. Such recommendation by the Compensation Committee is based on our overall performance against specific strategic and financial goals that are determined at the beginning of the fiscal year.
The Compensation Committee and Mr Mika believe that currently he is adequately incentivized to enhance profitability and stockholder value through his compensation package and his ownership of options. The Compensation Committee continues to retain the discretion to change the amount and form of compensation payable to Mr. Mika.
Through the programs described above, a significant portion of the each executive’s compensation is now linked directly to our financial performance. The policy of these programs is to award bonuses based on our success as well as to provide incentives to executives to enhance our financial performance and long-term stockholder value.
                                                                       Edward A. Dohring
                                                                       Jeffrey M. Krauss
                                                                       H. Duane Wadsworth
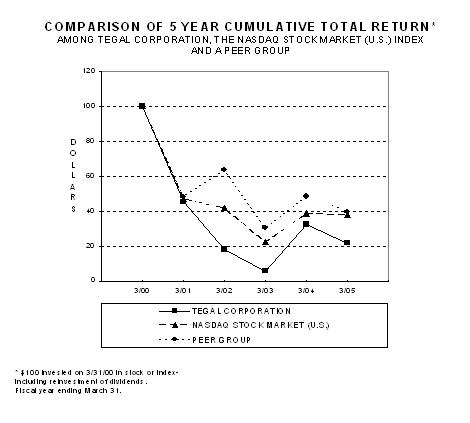
                                                 3/00       3/01       3/02      3/03         3/04       3/05
 Tegal Corporation..............................100.00.   45.28      18.11     5.74         32.45        21.58
 NASDAQ Stock Market (U.S.)....................100.00..   47.20      41.66     22.38        38.67        37.64
 Peer Group....................................100.00..   48.24      63.40     30.22        48.41        39.66

o        $100 Invested on 3/31/00 in stock or index, including investment of dividends. Fiscal year ending March 31.

o        + Peer group consists of the following companies: Applied Material Inc., Genus Inc., KLA-Tencor Corp., Lam Research Corp.,
         Mattson Technology, Inc., Novellus Systems, Inc. and Trikon Technologies, Inc.
The following table sets forth information concerning exercise of stock options during fiscal 2005 by each of the Named Executive Officers and the value of options at the end of fiscal 2005.
| Name | Shares
Acquired on Exercise(#) |
Value Realized ($) |
Number of Securities Underlying Unexercised Options at 2005 Year-End(#)(a) (Exercisable/ Unexercisable) |
Value of Unexercised
In-The-Money Options at 2005 Year-End($)(a) (Exercisable/ Unexercisable) | ||||||||||
|---|---|---|---|---|---|---|---|---|---|---|---|---|---|---|
| Michael L. Parodi | — | — | 922,500 /0 | $90,000/$0 | ||||||||||
| Thomas R. Mika | — | — | 239,583 /760,417 | $110,687/$312,312 | ||||||||||
| Steve Selbrede | — | — | 119,890 /158,250 | $14,300/$22,800 | ||||||||||
| Vahan Tchakerian | — | — | 8,941/ 308,941 | $3,576/$38,576 | ||||||||||
| Carole Anne Demachkie | — | — | 80,625/0 | $40,044/$0 | ||||||||||
_________________
| (a) | Potential unrealized value is (1) the fair market value at fiscal 2005 year-end ($1.43 per share) less the exercise price of “in-the-money” unexercised options times (2) the number of shares represented by such options. |
See Item 13, “Certain Relationships and Related Transactions.”
The following table sets forth information as of March 31, 2005 for all of our equity compensation plans, including our 1998 Equity Participation Plan, our 1990 Stock Option Plan, our Equity Incentive Plan and our Stock Option Plan for Outside Directors.
| Plan Category | Number of Securities to be Issued upon Exercise of Outstanding Options, Warrants and Rights (a) |
Weighted-Average Exercise Price of Outstanding Options, Warrants and Rights (b) |
Number of Securities Remaining Available for Future Issuance Under Equity Compensation Plans (Excluding Securities Reflected in Column(a)) (c) | ||||||||
|---|---|---|---|---|---|---|---|---|---|---|---|
| Equity compensation plans approved by | |||||||||||
| security holders | 11,964,205 | $ | 1 | .84 | 4,591,096 | (1) | |||||
| Equity compensation plans not approved by | |||||||||||
| security holders | — | — | — | ||||||||
| Total | 11,964,205 | $ | 1 | .84 | 4,591,096 | ||||||
_________________
(1) Excludes 540,952 shares remaining available for future issuance under our Employee Qualified Stock Purchase Plan.
The following table sets forth information with respect to the beneficial ownership of shares of our common stock by our directors, the individuals named in the Summary Compensation Table, all directors and executive officers as a group and beneficial owners of more than 5% of our common stock as of July 15, 2005. For purposes of this proxy, beneficial ownership of securities is defined in accordance with the rules of the SEC and means generally the power to vote or dispose of securities, regardless of any economic interest therein. An asterisk denotes beneficial ownership of less than 1%.
| Name of Beneficial Owner | Position | Shares Beneficially Owned(1) |
Percent of Class(1) | ||||||||
|---|---|---|---|---|---|---|---|---|---|---|---|
| Brad S. Mattson(2) | Chairman of the Board, | 650,000 | 1.08% | ||||||||
| Thomas R. Mika(3) | President & Chief Executive Officer | 756,083 | 1.26% | ||||||||
| Christine T. Hergenrother(4) | Vice President & Chief Financial Officer | 20,000 | * | ||||||||
| Steven Selbrede(5) | Vice President & Chief Technology Officer | 166,765 | * | ||||||||
| Vahan Tchakerian(6) | Vice President, Sales and Field Operations, North America | 88,107 | * | ||||||||
| Andy Clarke(7) | Vice President, Strategic PVD Product | 318,830 | * | ||||||||
| Michael L. Parodi(8) | Former Chairman of the Board, President and Chief Executive Officer | 974,000 | 1.61% | ||||||||
| Carole Anne Demachkie(9) | Former Vice President & General Manager, Sputtered Films, Inc. | 2,293 | * | ||||||||
| Jeffrey M. Krauss(10) | Director | 279,000 | * | ||||||||
| Edward A. Dohring(11) | Director | 271,000 | * | ||||||||
| H. Duane Wadsworth(12) | Director | 160,000 | * | ||||||||
| Directors and Executive Officers as a group (11 individuals)(13) | 3,686,078 | 5.88% | |||||||||
| 5% Stockholders | |||||||||||
| Special Situations Funds(14) | 5,464,806 | 8.80% | |||||||||
_________________
(1) Applicable percentage of ownership is based on 59,403,299 shares of common stock outstanding as of July 15, 2005. The number of
    shares of common stock beneficially owned and calculation of percent ownership of each person or group of persons named above, in
    each case, takes into account those shares underlying stock options that are currently exercisable, but which may or may not be
    subject to our repurchase rights held by such person or persons but not for any other person.

(2) Includes options to purchase 650,000 shares of common stock which are exercisable within 60 days and excludes options to purchase
    750,000 shares which are not so exercisable.

(3) Includes options to purchase 702,083 shares of common stock which are exercisable within 60 days and excludes options to purchase
    297,917 shares which are not so exercisable.

(4) Includes options to purchase 20,000 shares of common stock which are exercisable within 60 days and excludes options to purchase
    195,000 shares which are not so exercisable.

(5) Includes options to purchase 166,765 shares of common stock which are exercisable within 60 days and excludes options to purchase
    111,375 shares which are not so exercisable.

(6) Includes options to purchase 88,107 shares of common stock which are exercisable within 60 days and excludes options to purchase
    229,775 shares which are not so exercisable.

(7) Includes options to purchase 83,250 shares of common stock which are exercisable within 60 days and excludes options to purchase
    183,250 shares which are not so exercisable.

(8) Includes options to purchase 922,500 shares of common stock which are exercisable within 60 days and excludes options to purchase
    0 shares which are not so exercisable.

(9) Includes options to purchase 0 shares of common stock which are exercisable within 60 days and excludes options to purchase 0
    shares which are not so exercisable.

(10) Includes options to purchase 250,000 shares of common stock which are exercisable within 60 days and excludes options to
    purchase 0 shares which are not so exercisable.

(11) Includes options to purchase 270,000 shares of common stock which are exercisable within 60 days and excludes options to
    purchase 0 shares which are not so exercisable.

(12) Includes options to purchase 120,000 shares of common stock which are exercisable within 60 days and excludes options to
    purchase 0 shares which are not so exercisable.

(13) Includes options to purchase 3,272,705 shares of common stock which are exercisable within 60 days and excludes options to
    purchase 1,767,317 shares which are not so exercisable.

(14) Includes 2,800,000 shares of common stock and 2,664,806 shares of common stock underlying warrants beneficially
    owned by Special Situations Funds. Special Situations Fund III, L.P., holds 1,495,200 shares of common stock
    and 747,600 shares of common stock underlying warrants; Special Situations Cayman Fund, L.P., holds 378,000
    shares of common stock and 189,000 shares of common stock underlying warrants;  Special Situations Private
    Equity Fund, L.P., holds 389,760 shares of common stock and 940,823 shares of common stock underlying
    warrants; Special Situations Technology Fund, L.P., holds 73,640 shares of common stock and 121,805 shares of
    common stock underlying warrants; and Special Situations Technology Fund II, L.P., holds 463,400 shares of
    common stock and 665,578 shares of common stock underlying warrants.  MGP Advisers Limited (“MGP”) is the
    general partner of Special Situations Fund III, L.P.  AWM Investment Company, Inc. (“AWM”) is the general
    partner of MGP and the general partner of and investment adviser to the Special Situations Cayman Fund, L.P.
    SST Advisers, L.L.C. (“SSTA”) is the general partner of and investment adviser to the Special Situations
    Technology Fund, L.P. and the Special Situations Technology Fund II, L.P. MG Advisers, L.L.C. (“MG”) is the
    general partner of and investment adviser to the Special Situations Private Equity Fund, L.P.  Austin W.
    Marxe and David M. Greenhouse are the principal owners of MGP, AWM, SSTA and MG.  Through their control of
    MGP, AWM, SSTA and MG, Messrs. Marxe and Greenhouse share voting and investment control over the portfolio
    securities of each of the funds listed above  Special Situations Funds are located at 153 E. 53rd Street, New
    York, NY 10022. These funds have the right to purchase additional shares subject to stockholder approval.
    See our Current Report on Form 8-K filed with the Securities and Exchange Commission on July 11, 2005.
Since April 1, 2004, there has not been, nor is there currently planned, any transaction or series of similar transactions to which we were or are a party in which the amount involved exceeds $60,000 and in which any director, nominee for director, executive officer or holder of more than 5% of our capital stock or any member of their immediate families had or will have a direct or indirect material interest other than the agreements and transactions described below.
Mr. Mika serves as our President and Chief Executive Officer pursuant to an employment agreement which renews annually. Mr. Mika is eligible for a discretionary annual bonus not less than 35% of his base salary and was granted options in August 2002 with a four-year vesting period at the commencement of his employment. In addition, we agreed to reimburse Mr. Mika for his actual costs incurred in moving to California. We may terminate his employment with or without cause and Mr. Mika may terminate his employment with us upon thirty days prior written notice. If we terminate his employment without cause, Mr. Mika is entitled to receive his salary and benefits for 12 months following the date of such termination and up to 18 months should Mr. Mika remain continuously unemployed. If Mr. Mika voluntarily leaves the company for “good reason,” Mr. Mika is entitled to receive up to 18 months of salary and benefits.
Mr. Selbrede serves as our Vice President, Chief Technology Officer. Mr.Selbrede is eligible for any incentive bonus payments from time to time in accordance with any incentive bonus program then in effect. Stock options in the amount of 250,000 shares were granted in May of 2004 with a 4-year vesting schedule. In addition, we agreed to reimburse Mr. Selbrede for his actual costs not to exceed $15,000 incurred in relocating to the Petaluma, CA area. We may terminate his employment with or without cause and Mr. Selbrede may terminate his employment with us upon fourteen days prior written notice. If we terminate his employment without cause, Mr. Selbrede is entitled to receive his salary and benefits for 6 months following the date of such termination. If Mr. Selbrede voluntarily leaves the company for “good reason,” he is not entitled to any salary and benefit continuation.
Mr. Clarke serves as our Vice President, Stategic PVD products. Mr. Clarke is eligible for any incentive bonus payments from time to time in accordance with any incentive bonus program then in effect. Stock options in the amount of 200,000 shares were granted in May of 2004 with an incentive based vesting schedule. In addition, we agreed to reimburse Mr. Clarke for his actual costs not to exceed $20,000 incurred in relocating to the Petaluma, CA area. We may terminate his employment with or without cause and Mr. Clarke may terminate his employment with us upon fourteen days prior written notice. If we terminate his employment without cause, Mr. Clarke is entitled to receive his salary and benefits for 6 months following the date of such termination. If Mr. Clarke voluntarily leaves the company for “good reason,” he is not entitled to any salary and benefit continuation.
In addition, the Board of Directors has approved a severance arrangement for executive officers in the event of a change of control of Tegal. If an executive officer is terminated as a result of a change of control, we shall continue to pay such executive officer’s base salary and certain benefits for a period of 12 months.
The aggregate fees billed for professional services rendered by Moss Adams LLP for the audit of our annual financial statements for the fiscal year ended March 31, 2005, the reviews of the financial statements included in our quarterly reports on Form 10-Q for the fiscal year ending March 31, 2005, and services that are normally provided by the Moss Adams LLP in connection with statutory and regulatory filings and engagements for that fiscal year were $205,385. The aggregate fees for the services listed above rendered by PricewaterhouseCoopers LLP for the fiscal year ending March 31, 2004 were $298,235.
Moss Adams LLP did not render any professional services to us of the type described in Rule 2-01(c)(4)(ii) of Regulation S-X during the fiscal year ended March 31, 2005.
The aggregate fees billed by PricewaterhouseCoopers LLP for assurance and related services that were reasonably related to the performance of the audit or review of Tegal's financial statements and are not reported above under "Audit Fees" were $8,000 during the fiscal year ending March 31, 2005. Audit related fees were $5,000 during fiscal year ending March 31, 2004. The services for the fees disclosed under this category were for work done in relation to the Company's acquisition of Simplus Systems, Inc.
The aggregate fees billed by PricewaterhouseCoopers LLP for professional services rendered for tax compliance, tax advice, and tax planning were $3,500 during the fiscal year ending March 31, 2005 and $81,931 during the fiscal year ending March 31, 2004.
The aggregate fees billed by Burr, Pilger & Mayer, LLP for professional services rendered for tax compliance, tax advice, and tax planning were $42,250 during the fiscal year ending March 31, 2005.
The Audit Committee has adopted a policy that requires the Audit Committee to approve all audit and permissible non-audit services to be provided by the independent auditors. The Audit Committee has established a general pre-approval policy for certain audit and non-audit services, up to a specified amount for each identified service that may be provided by the independent auditors. The Chairman of the Audit Committee may specifically approve any service within the pre-approved audit and non-audit service category if the fees for such service exceed the maximum set forth in the policy, as long as the excess fees are not reasonably expected to exceed $50,000. Any such approval by the Chairman must be reported to the Audit Committee at its next scheduled meeting. The general pre-approval fee levels for all services to be provided by the independent auditors are reviewed annually by the Audit Committee. The Company's non-audit services, other than the annual tax return, provided by PricewaterhouseCoopers LLP and Moss Adams LLP were 35% of the total audit fees for the fiscal year ended March 31, 2005. The Company's annual tax return services provided by Burr, Pilger & Mayer were 20% of the total audit fees for the fiscal year ended March 31, 2005.
(a) The following documents are filed as part of this Form 10-K:
(1) Financial Statements
The Company’s Financial Statements and notes thereto appear in this Form 10-K according to the following Index of Consolidated Financial Statements:
| Page | |||||
|---|---|---|---|---|---|
| Consolidated Balance Sheets as of March 31, 2004 and 2003 | 27 | ||||
| Consolidated Statements of Operations for the years ended March 31, 2004, 2003 and 2002 | 28 | ||||
| Consolidated Statements of Stockholders' Equity for the years ended March 31, 2004, 2003 and 2002 | 29 | ||||
| Consolidated Statements of Cash Flows for the years ended March 31, 2004, 2003 and 2002 | 30 | ||||
| Notes to Consolidated Financial Statements | 32 | ||||
| Report of Independent Registered Public Accounting Firm | 49 | ||||
(2) Financial Statement Schedule
| Page | |||||
|---|---|---|---|---|---|
| Schedule II— Valuation and Qualifying Accounts | 69 | ||||
Schedules other than those listed above have been omitted since they are either not required, not applicable, or the required information is shown in the consolidated financial statements or related notes.
(b) Exhibits
The following exhibits are referenced or included in this report:
| Exhibit Number |
Description |
|---|---|
| 2.1 | Agreement and Plan of Merger by and among Tegal Corporation, SFI Acquisition Corp., Sputtered Films, Inc. and the Shareholder Agent dated as of August 13, 2002 (incorporated by reference to Exhibit 2.1 to the Registrant's Current Report on Form 8-K filed with the Securities and Exchange Commission on August 16, 2002) |
| 2.2 | Asset Acquisition Agreement by and between Tegal Corporation and First Derivative Systems, Inc., dated April 28, 2004 (incorporated by reference to Exhibit 2.1 to Registrant's Quarterly Report on Form 10-Q filed with the Securities and Exchange Commission on August 16, 2004) |
| 3.1 | Certificate of Incorporation of the Registrant, as amended (incorporated by reference to Exhibits 3(i).1 and 3(i).2 included in Registrant's Registration Statement on Form S-1 (File No. 33-84702) declared effective by the Securities and Exchange Commission on October 18, 1995) |
| 3.2 | Amendment to the Certificate of Incorporation (incorporated by reference to Exhibit 4.2 to the Registrant's Registration Statement on Form S-3 (File No. 333-108921) declared effective by the Securities and Exchange Commission on October 14, 2003) |
| 3.3 | By-laws of Registrant (incorporated by reference to Exhibit 3(ii) included in Registrant's Registration Statement on Form S-1 (File No. 33-84702) declared effective by the Securities and Exchange Commission on October 18, 1995) |
| 4.1 | Form of Certificate for Common Stock (incorporated by reference to Exhibit 4.1 to the Registrant's Registration Statement on Form S-1 (File No. 33-84702) declared effective by the Securities and Exchange Commission on October 18, 1995) |
| 4.2 | Rights Agreement between the Registrant and ChaseMellon Shareholder Services dated as of June 11, 1996 (incorporated by reference to the Registrant's Current Report on Form 8-K filed with the Securities and Exchange Commission on June 28, 1996) |
| 4.3 | First Amendment to Rights Agreement between the Registrant and ChaseMellon Shareholder Services, dated as of January 15, 1999 (incorporated by reference to Exhibit 99.1 to the Registrant's Current Report on Form 8-K filed with the Securities and Exchange Commission on January 1, 1999) |
| 4.4 | Amendment to Rights Agreement dated January 18, 2005 (incorporated by reference to Exhibit 4.1 to Registrant's Quarterly Report on Form 10-Q filed with the Securities and Exchange Commission on February 14, 2005). |
| 10.1 | Form of Unit Purchase Agreement dated December 31, 2001 (incorporated by reference to Exhibit (i) to the Registrant's Quarterly Report on Form 10-Q filed with the Securities and Exchange Commission on February 13, 2002) |
| 10.2 | Form of Warrant (incorporated by reference to Exhibit (ii) to the Registrant's Quarterly Report on Form 10-Q filed with the Securities and Exchange Commission on February 13, 2002) |
| 10.3 | Form of Unit Subscription Agreement dated June 30, 2003 (incorporated by reference to Exhibit 4.1 to the Registrant's Current Report on Form 8-K filed with the Securities and Exchange Commission on July 2, 2003) |
| 10.4 | Form of Warrant dated June 30, 2003 (incorporated by reference to Exhibit 4.5 to the Registrant's Current Report on Form 8-K filed with the Securities and Exchange Commission on July 2, 2003) |
| 10.5 | Form of Debenture dated June 30, 2003 (incorporated by reference to Exhibit 4.4 to the Registrant's Current Report on Form 8-K filed with the Securities and Exchange Commission on July 2, 2003) |
| 10.6 | Form of Security Agreement between the Registrant and Orin Hirschmann dated June 30, 2003 (incorporated by reference to Exhibit 4.2 to the Registrant's Current Report on Form 8-K filed with the Securities and Exchange Commission on July 2, 2003) |
| **10.7 | Fourth Amended and Restated Stock Option Plan for Outside Directors (incorporated by reference to Appendix B to the Registrant's revised definitive proxy statement on Schedule 14A filed with the Securities and Exchange Commission on July 29, 2004) |
| **10.8 | Sixth Amended and Restated 1998 Equity Participation Plan of Tegal Corporation (incorporated by reference to Appendix A to the Registrant's revised definitive proxy statement on Schedule 14A filed with the Securities and Exchange Commission on July 29, 2004) |
| **10.10 | Second Amended and Restated Employee Qualified Stock Purchase Plan (incorporated by reference to Appendix C to the Registrant's revised definitive proxy statement on Schedule 14A filed with the Securities and Exchange Commission on July 29, 2004) |
| **10.11 | 1990 Stock Option Plan (incorporated by reference to Exhibit 10.2 to the Registrant's Registration Statement on Form S-1 (File No. 33-84702) declared effective by the Securities and Exchange Commission on October 18, 1995) |
| 10.12 | Ninth Amendment to Lease between the Registrant and Jane Crocker, formerly Jane C. Jacobs, as Trustee under the Jane C. Jacobs Trust Agreement dated October 5, 1990 ("Crocker") and Norman E. MacKay ("MacKay") dated as of April 29, 2003 (incorporated by reference to Exhibit 10.7 to the Registrant's Annual Report on Form 10-K for the fiscal year ended March 31, 2004 filed with the Securities and Exchange Commission on June 29, 2004) 10.12 |
| **10.13 | Form of Non-Qualified Stock Option Agreement for Employees from the Sixth Amended and Restated 1998 Equity Participation Plan (incorporated by reference to Exhibit 10.1 to the Registrant's Quarterly Report on Form 10-Q filed with the Securities and Exchange Commission on November 12, 2004) |
| **10.14 | Form of Stock Option Agreement for Outside Directors (incorporated by reference to Exhibit 10.2 to the Registrant's Quarterly Report on Form 10-Q filed with the Securities and Exchange Commission on November 12, 2004) |
| **10.16 | Employment Agreement between the Registrant and Thomas Mika dated as of August 12, 2002 (incorporated by reference to Exhibit 10.11 to the Registrant's Annual Report on Form 10-K for the fiscal year ended March 31, 2003 filed with the Securities and Exchange Commission on June 27, 2003) |
| **10.17 | Employment Agreement between the Registrant and Andy Clarke dated as of May 28, 2004 (incorporated by reference to Exhibit 10.17 to the Registrant's Annual Report on Form 10-K for the fiscal year ended March 31, 2005 filed with the Securities and Exchange Commission on June 29, 2005) |
| **10.18 | Employment Agreement between the Registrant and Steve Selbrede dated as of May 3, 2004 (incorporated by reference to Exhibit 10.18 to the Registrant's Annual Report on Form 10-K for the fiscal year ended March 31, 2005 filed with the Securities and Exchange Commission on June 29, 2005) |
| 16.11 | Letter of PricewaterhouseCoopers LLP to the Securities and Exchange Commission dated July 13, 2004 (incorporated by reference to Exhibit 16.1 to the Registrant's Current Report on Form 8-K filed with the Securities and Exchange Commission on July 14, 2004) |
| 21.1 | List of Subsidiaries of the Registrant (incorporated by reference to Exhibit 21.1 to the Registrant's Registration Statement on Form S-1 (File No. 33-84702) declared effective by the Securities and Exchange Commission on October 18, 1995) |
| 23.1 | Consent of Independent Registered Public Accounting Firm – Moss Adams LLP |
| 23.2 | Consent of Independent Registered Public Accounting Firm – PricewaterhouseCoopers LLP |
| 24.1 | Power of Attorney (incorporated by reference to the signature page to the Registrant's Annual Report on Form 10-K filed with the Securities and Exchange Commission on June 29, 2005) |
| 31.1 | Section 302 Certification of the Chief Executive Officer |
| 31.2 | Section 302 Certification of the Chief Financial Officer |
| 32.1 | Section 906 Certification of the Chief Executive Officer and Chief Financial Officer |
| ** Management contract for compensatory plan or arrangement. |
| Description | Balance At Beginning of Year |
Charged to Costs and Expenses |
Charged to Other Accounts |
Deductions | Balance At End of Year | ||||||||||||
|---|---|---|---|---|---|---|---|---|---|---|---|---|---|---|---|---|---|
| Year ended March 31, 2003: | |||||||||||||||||
| Allowances for doubtful accounts | 339 | 64 | — | (238 | ) | 165 | |||||||||||
| Sales returns and allowances | 43 | 44 | — | (65 | ) | 22 | |||||||||||
| Cash discounts | 17 | 16 | — | (7 | ) | 26 | |||||||||||
| Year ended March 31, 2004: | |||||||||||||||||
| Allowances for doubtful accounts | 165 | 64 | — | (19 | ) | 210 | |||||||||||
| Sales returns and allowances | 22 | 38 | — | (1 | ) | 59 | |||||||||||
| Cash discounts | 26 | (20 | ) | — | (5 | ) | 1 | ||||||||||
| Year ended March 31, 2005: | |||||||||||||||||
| Allowances for doubtful accounts | 210 | 335 | — | (3 | ) | 542 | |||||||||||
| Sales returns and allowances | 59 | (69 | ) | — | — | (10 | ) | ||||||||||
| Cash discounts | 1 | 6 | — | (6 | ) | 1 | |||||||||||
Pursuant to the requirements of Section 13 or 15(d) of the Securities Exchange Act of 1934, the registrant has duly caused this report to be signed on its behalf by the undersigned, thereunto duly authorized.
| TEGAL CORPORATION By: /s/ THOMAS R. MIKA Thomas R. Mika President & Chief Executive Officer | |
| Dated: July 29, 2005 |
Pursuant to the requirements of the Securities Exchange Act of 1934, this report has been signed below by the following persons on behalf of the registrant and in the capacities and on the dates indicated.
| Signature | Title | Date |
|---|---|---|
| /s/ THOMAS R. MIKA Thomas R. Mika |
President and Chief Executive Officer (Principal Executive Officer) |
June 29, 2005 |
| /s/ CHRISTINE T. HERGENROTHER* Christine T. Hergenrother |
Chief Financial Officer (Principal Financial and Accounting Officer) |
July 29, 2005 |
| /s/ BRAD MATTSON* Brad Mattson |
Chairman of the Board | July 29, 2005 |
| /s/ EDWARD A. DOHRING* Edward A. Dohring |
Director | July 29, 2005 |
| /s/ JEFFREY M. KRAUSS* Jeffrey M. Krauss |
Director | July 29, 2005 |
| /s/ DUANE WADSWORTH* Duane Wadsworth |
Director | July 29, 2005 |
| *By: /s/ THOMAS R. MIKA Thomas R. Mika Attorney-in-fact |
| Exhibit Number |
Description |
|---|---|
| 2.1 | Agreement and Plan of Merger by and among Tegal Corporation, SFI Acquisition Corp., Sputtered Films, Inc. and the Shareholder Agent dated as of August 13, 2002 (incorporated by reference to Exhibit 2.1 to the Registrant's Current Report on Form 8-K filed with the Securities and Exchange Commission on August 16, 2002) |
| 2.2 | Asset Acquisition Agreement by and between Tegal Corporation and First Derivative Systems, Inc., dated April 28, 2004 (incorporated by reference to Exhibit 2.1 to Registrant's Quarterly Report on Form 10-Q filed with the Securities and Exchange Commission on August 16, 2004) |
| 3.1 | Certificate of Incorporation of the Registrant, as amended (incorporated by reference to Exhibits 3(i).1 and 3(i).2 included in Registrant's Registration Statement on Form S-1 (File No. 33-84702) declared effective by the Securities and Exchange Commission on October 18, 1995) |
| 3.2 | Amendment to the Certificate of Incorporation (incorporated by reference to Exhibit 4.2 to the Registrant's Registration Statement on Form S-3 (File No. 333-108921) declared effective by the Securities and Exchange Commission on October 14, 2003) |
| 3.3 | By-laws of Registrant (incorporated by reference to Exhibit 3(ii) included in Registrant's Registration Statement on Form S-1 (File No. 33-84702) declared effective by the Securities and Exchange Commission on October 18, 1995) |
| 4.1 | Form of Certificate for Common Stock (incorporated by reference to Exhibit 4.1 to the Registrant's Registration Statement on Form S-1 (File No. 33-84702) declared effective by the Securities and Exchange Commission on October 18, 1995) |
| 4.2 | Rights Agreement between the Registrant and ChaseMellon Shareholder Services dated as of June 11, 1996 (incorporated by reference to the Registrant's Current Report on Form 8-K filed with the Securities and Exchange Commission on June 28, 1996) |
| 4.3 | First Amendment to Rights Agreement between the Registrant and ChaseMellon Shareholder Services, dated as of January 15, 1999 (incorporated by reference to Exhibit 99.1 to the Registrant's Current Report on Form 8-K filed with the Securities and Exchange Commission on January 1, 1999) |
| 4.4 | Amendment to Rights Agreement dated January 18, 2005 (incorporated by reference to Exhibit 4.1 to Registrant's Quarterly Report on Form 10-Q filed with the Securities and Exchange Commission on February 14, 2005). |
| 10.1 | Form of Unit Purchase Agreement dated December 31, 2001 (incorporated by reference to Exhibit (i) to the Registrant's Quarterly Report on Form 10-Q filed with the Securities and Exchange Commission on February 13, 2002) |
| 10.2 | Form of Warrant (incorporated by reference to Exhibit (ii) to the Registrant's Quarterly Report on Form 10-Q filed with the Securities and Exchange Commission on February 13, 2002) |
| 10.3 | Form of Unit Subscription Agreement dated June 30, 2003 (incorporated by reference to Exhibit 4.1 to the Registrant's Current Report on Form 8-K filed with the Securities and Exchange Commission on July 2, 2003) |
| 10.4 | Form of Warrant dated June 30, 2003 (incorporated by reference to Exhibit 4.5 to the Registrant's Current Report on Form 8-K filed with the Securities and Exchange Commission on July 2, 2003) |
| 10.5 | Form of Debenture dated June 30, 2003 (incorporated by reference to Exhibit 4.4 to the Registrant's Current Report on Form 8-K filed with the Securities and Exchange Commission on July 2, 2003) |
| 10.6 | Form of Security Agreement between the Registrant and Orin Hirschmann dated June 30, 2003 (incorporated by reference to Exhibit 4.2 to the Registrant's Current Report on Form 8-K filed with the Securities and Exchange Commission on July 2, 2003) |
| **10.7 | Fourth Amended and Restated Stock Option Plan for Outside Directors (incorporated by reference to Appendix B to the Registrant's revised definitive proxy statement on Schedule 14A filed with the Securities and Exchange Commission on July 29, 2004) |
| **10.8 | Sixth Amended and Restated 1998 Equity Participation Plan of Tegal Corporation (incorporated by reference to Appendix A to the Registrant's revised definitive proxy statement on Schedule 14A filed with the Securities and Exchange Commission on July 29, 2004) |
| **10.10 | Second Amended and Restated Employee Qualified Stock Purchase Plan (incorporated by reference to Appendix C to the Registrant's revised definitive proxy statement on Schedule 14A filed with the Securities and Exchange Commission on July 29, 2004) |
| **10.11 | 1990 Stock Option Plan (incorporated by reference to Exhibit 10.2 to the Registrant's Registration Statement on Form S-1 (File No. 33-84702) declared effective by the Securities and Exchange Commission on October 18, 1995) |
| 10.12 | Ninth Amendment to Lease between the Registrant and Jane Crocker, formerly Jane C. Jacobs, as Trustee under the Jane C. Jacobs Trust Agreement dated October 5, 1990 ("Crocker") and Norman E. MacKay ("MacKay") dated as of April 29, 2003 (incorporated by reference to Exhibit 10.7 to the Registrant's Annual Report on Form 10-K for the fiscal year ended March 31, 2004 filed with the Securities and Exchange Commission on June 29, 2004) 10.12 |
| **10.13 | Form of Non-Qualified Stock Option Agreement for Employees from the Sixth Amended and Restated 1998 Equity Participation Plan (incorporated by reference to Exhibit 10.1 to the Registrant's Quarterly Report on Form 10-Q filed with the Securities and Exchange Commission on November 12, 2004) |
| **10.14 | Form of Stock Option Agreement for Outside Directors (incorporated by reference to Exhibit 10.2 to the Registrant's Quarterly Report on Form 10-Q filed with the Securities and Exchange Commission on November 12, 2004) |
| **10.16 | Employment Agreement between the Registrant and Thomas Mika dated as of August 12, 2002 (incorporated by reference to Exhibit 10.11 to the Registrant's Annual Report on Form 10-K for the fiscal year ended March 31, 2003 filed with the Securities and Exchange Commission on June 27, 2003) |
| **10.17 | Employment Agreement between the Registrant and Andy Clarke dated as of May 28, 2004 (incorporated by reference to Exhibit 10.17 to the Registrant's Annual Report on Form 10-K for the fiscal year ended March 31, 2005 filed with the Securities and Exchange Commission on June 29, 2005) |
| **10.18 | Employment Agreement between the Registrant and Steve Selbrede dated as of May 3, 2004 (incorporated by reference to Exhibit 10.18 to the Registrant's Annual Report on Form 10-K for the fiscal year ended March 31, 2005 filed with the Securities and Exchange Commission on June 29, 2005) |
| 16.11 | Letter of PricewaterhouseCoopers LLP to the Securities and Exchange Commission dated July 13, 2004 (incorporated by reference to Exhibit 16.1 to the Registrant's Current Report on Form 8-K filed with the Securities and Exchange Commission on July 14, 2004) |
| 21.1 | List of Subsidiaries of the Registrant (incorporated by reference to Exhibit 21.1 to the Registrant's Registration Statement on Form S-1 (File No. 33-84702) declared effective by the Securities and Exchange Commission on October 18, 1995) |
| 23.1 | Consent of Independent Registered Public Accounting Firm – Moss Adams LLP |
| 23.2 | Consent of Independent Registered Public Accounting Firm – PricewaterhouseCoopers LLP |
| 24.1 | Power of Attorney (incorporated by reference to the signature page to the Registrant's Annual Report on Form 10-K filed with the Securities and Exchange Commission on June 29, 2005) |
| 31.1 | Section 302 Certification of the Chief Executive Officer |
| 31.2 | Section 302 Certification of the Chief Financial Officer |
| 32.1 | Section 906 Certification of the Chief Executive Officer and Chief Financial Officer |
| ** Management contract for compensatory plan or arrangement. |
EXHIBIT 23.1
We hereby consent to the incorporation by reference in the Registration Statements on Forms S-8 (Nos. 333-12473, 333-66781, 333-88373, 333-51294, 333-110650 and 333-119272), Form S-2 (No. 333-83840) and Forms S-3 (Nos. 333-38086, 333-94093, 333-107422, 333-108921, 333-113045, 333-116980 and 333-118641) of our report on the audit of the consolidated financial statements of Tegal Corporation as of March 31, 2005, and for the year then ended. Our report, which is dated May 27, 2005 appears in Tegal Corporation’s Annual Report on Form 10-K/A for the year ended March 31, 2005.
/s/ Moss Adams LLP
Santa Rosa, California
July
29, 2005
EXHIBIT 23.2
We hereby consent to the incorporation by reference in the Registration Statements on Forms S-8 (Nos. 333-12473, 333-66781, 333-88373, 333-51294, 333-110650 and 333-119272), Form S-2 (No. 333-83840) and Forms S-3 (Nos. 333-38086, 333-94093, 333-107422, 333-108921, 333-113045, 333-116980 and 333-118641) of Tegal Corporation of our report dated June 25, 2004 relating to the consolidated financial statements and financial statement schedule, which appears in this Form 10-K/A.
/s/ PricewaterhouseCoopers LLP
San Jose, California
July
29, 2005
EXHIBIT 31.1
I, Thomas R. Mika, certify that:
| 1. | I have reviewed this amended annual report on Form 10-K/A of Tegal Corporation; |
| 2. | Based on my knowledge, this report does not contain any untrue statement of a material fact or omit to state a material fact necessary to make the statements made, in light of the circumstances under which such statements were made, not misleading with respect to the period covered by this report; |
| 3. | Based on my knowledge, the financial statements, and other financial information included in this report, fairly present in all material respects the financial condition, results of operations and cash flows of the registrant as of, and for, the periods presented in this report; |
| 4. | The registrant’s other certifying officer and I are responsible for establishing and maintaining disclosure controls and procedures (as defined in Exchange Act Rules 13a-15(e) and 15d-14(e)) for the registrant and we have: |
| (a) | designed such disclosure controls and procedures, or caused such disclosure controls and procedures to be designed under our supervision, to ensure that material information relating to the registrant, including its consolidated subsidiaries, is made known to us by others within those entities, particularly during the period in which this report is being prepared; |
| (b) | evaluated the effectiveness of the registrant’s disclosure controls and procedures and presented in this report our conclusions about the effectiveness of the disclosure controls and procedures, as of the end of the period covered by this report based on such evaluation; |
| (c) | disclosed in this report any change in the registrant’s internal control over financial reporting that occurred during the registrant’s most recent fiscal quarter (the registrant’s fourth fiscal quarter in the case of an annual report) that has materially affected, or is reasonably likely to materially affect, the registrant’s internal control over financial reporting; and |
| 5. | The registrant’s other certifying officer(s) and I have disclosed, based on our most recent evaluation of internal control over financial reporting, to the registrant’s auditors and the audit committee of the registrant’s board of directors (or persons performing the equivalent function): |
| (a) | all significant deficiencies and material weaknesses in the design or operation of internal control over financial reporting which are reasonably likely to adversely affect the registrant’s ability to record, process, summarize and report financial information; and |
| (b) | any fraud, whether or not material, that involves management or other employees who have a significant role in the registrant’s internal controls over financial reporting. |
| Date: July 29, 2005 | /s/ THOMAS R. MIKA |
| Thomas R. Mika Chief Executive Officer and President |
EXHIBIT 31.2
I, Christine Hergenrother, certify that:
| 1. | I have reviewed this amended annual report on Form 10-K/A of Tegal Corporation; |
| 2. | Based on my knowledge, this report does not contain any untrue statement of a material fact or omit to state a material fact necessary to make the statements made, in light of the circumstances under which such statements were made, not misleading with respect to the period covered by this report; |
| 3. | Based on my knowledge, the financial statements, and other financial information included in this report, fairly present in all material respects the financial condition, results of operations and cash flows of the registrant as of, and for, the periods presented in this report; |
| 4. | The registrant’s other certifying officer and I are responsible for establishing and maintaining disclosure controls and procedures (as defined in Exchange Act Rules 13a-15(e) and 15d-14(e)) for the registrant and we have: |
| (a) | designed such disclosure controls and procedures, or caused such disclosure controls and procedures to be designed under our supervision, to ensure that material information relating to the registrant, including its consolidated subsidiaries, is made known to us by others within those entities, particularly during the period in which this report is being prepared; |
| (b) | evaluated the effectiveness of the registrant’s disclosure controls and procedures and presented in this report our conclusions about the effectiveness of the disclosure controls and procedures, as of the end of the period covered by this report based on such evaluation; |
| (c) | disclosed in this report any change in the registrant’s internal control over financial reporting that occurred during the registrant’s most recent fiscal quarter (the registrant’s fourth fiscal quarter in the case of an annual report) that has materially affected, or is reasonably likely to materially affect, the registrant’s internal control over financial reporting; and |
| 5. | The registrant’s other certifying officer(s) and I have disclosed, based on our most recent evaluation of internal control over financial reporting, to the registrant’s auditors and the audit committee of the registrant’s board of directors (or persons performing the equivalent function): |
| (a) | all significant deficiencies and material weaknesses in the design or operation of internal control over financial reporting which are reasonably likely to adversely affect the registrant’s ability to record, process, summarize and report financial information; and |
| (b) | any fraud, whether or not material, that involves management or other employees who have a significant role in the registrant’s internal controls over financial reporting. |
| Date: July 29, 2005 | /s/ CHRISTINE T. HERGENROTHER |
| Christine T. Hergenrother Chief Financial Officer |
EXHIBIT 32.1
In connection with the amended Annual Report of Tegal Corporation, a Delaware corporation (the “Company”), on Form 10-K/A for the year ending March 31, 2004 as filed with the Securities and Exchange Commission (the “Report”), I, Thomas R. Mika, President and Chief Executive Officer of the Company, certify, pursuant to § 906 of the Sarbanes-Oxley Act of 2002 (18 U.S.C. § 1350), that to my knowledge:
(1) The Report fully complies with the requirements of section 13(a) or 15(d) of the Securities Exchange Act of 1934, as amended; and
(2) The information contained in the Report fairly presents, in all material respects, the financial condition and result of operations of the Company.
/s/ Thomas
R. Mika
Chief Executive Officer and President
July 29, 2005
In connection with the amended Annual Report of Tegal Corporation, a Delaware corporation (the “Company”), on Form 10-K/A for the year ending March 31, 2005 as filed with the Securities and Exchange Commission (the “Report”), I, Christine Hergenrother, Chief Financial Officer of the Company, certify, pursuant to § 906 of the Sarbanes-Oxley Act of 2002 (18 U.S.C. § 1350), that to my knowledge:
(1) The Report fully complies with the requirements of section 13(a) or 15(d) of the Securities Exchange Act of 1934, as amended; and
(2) The information contained in the Report fairly presents, in all material respects, the financial condition and result of operations of the Company.
/s/ Christine T. Hergenrother
Chief Financial Officer
July 29, 2005